Immigrants from Fiji vs Panamanian 11th Grade
COMPARE
Immigrants from Fiji
Panamanian
11th Grade
11th Grade Comparison
Immigrants from Fiji
Panamanians
89.9%
11TH GRADE
0.0/ 100
METRIC RATING
298th/ 347
METRIC RANK
92.3%
11TH GRADE
26.4/ 100
METRIC RATING
196th/ 347
METRIC RANK
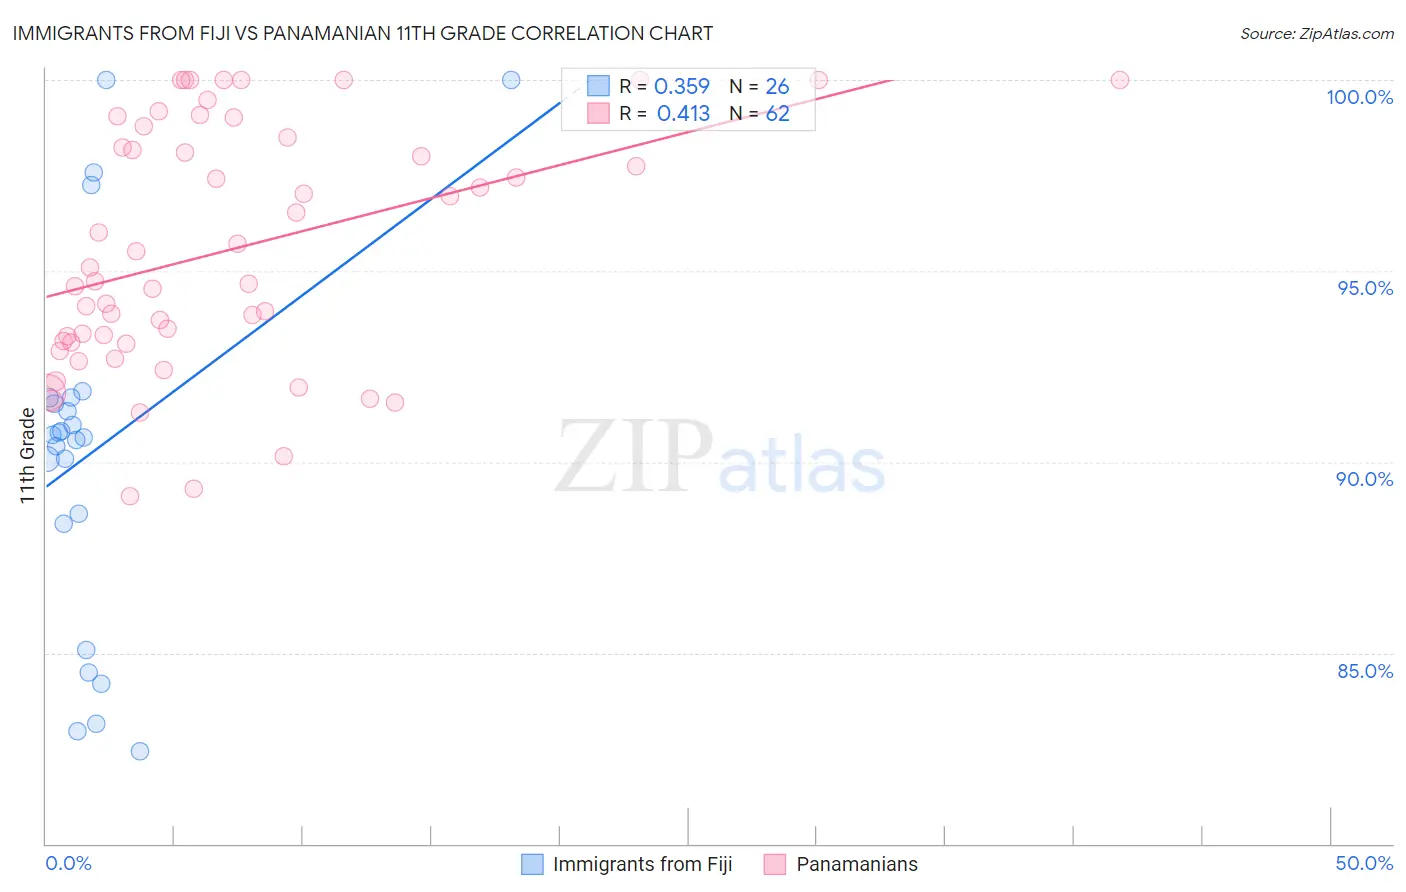
Immigrants from Fiji vs Panamanian 11th Grade Correlation Chart
The statistical analysis conducted on geographies consisting of 93,756,204 people shows a mild positive correlation between the proportion of Immigrants from Fiji and percentage of population with at least 11th grade education in the United States with a correlation coefficient (R) of 0.359 and weighted average of 89.9%. Similarly, the statistical analysis conducted on geographies consisting of 281,248,945 people shows a moderate positive correlation between the proportion of Panamanians and percentage of population with at least 11th grade education in the United States with a correlation coefficient (R) of 0.413 and weighted average of 92.3%, a difference of 2.6%.
11th Grade Correlation Summary
| Measurement | Immigrants from Fiji | Panamanian |
| Minimum | 82.4% | 89.1% |
| Maximum | 100.0% | 100.0% |
| Range | 17.6% | 10.9% |
| Mean | 90.3% | 95.6% |
| Median | 90.7% | 94.9% |
| Interquartile 25% (IQ1) | 88.4% | 93.1% |
| Interquartile 75% (IQ3) | 91.7% | 98.5% |
| Interquartile Range (IQR) | 3.3% | 5.4% |
| Standard Deviation (Sample) | 4.8% | 3.2% |
| Standard Deviation (Population) | 4.7% | 3.1% |
Similar Demographics by 11th Grade
Demographics Similar to Immigrants from Fiji by 11th Grade
In terms of 11th grade, the demographic groups most similar to Immigrants from Fiji are Japanese (89.9%, a difference of 0.030%), Immigrants from Haiti (89.9%, a difference of 0.040%), Guyanese (89.9%, a difference of 0.050%), Navajo (90.0%, a difference of 0.070%), and Fijian (90.0%, a difference of 0.11%).
| Demographics | Rating | Rank | 11th Grade |
| Haitians | 0.0 /100 | #291 | Tragic 90.3% |
| Cubans | 0.0 /100 | #292 | Tragic 90.2% |
| Natives/Alaskans | 0.0 /100 | #293 | Tragic 90.2% |
| Immigrants | Grenada | 0.0 /100 | #294 | Tragic 90.1% |
| Immigrants | Vietnam | 0.0 /100 | #295 | Tragic 90.0% |
| Fijians | 0.0 /100 | #296 | Tragic 90.0% |
| Navajo | 0.0 /100 | #297 | Tragic 90.0% |
| Immigrants | Fiji | 0.0 /100 | #298 | Tragic 89.9% |
| Japanese | 0.0 /100 | #299 | Tragic 89.9% |
| Immigrants | Haiti | 0.0 /100 | #300 | Tragic 89.9% |
| Guyanese | 0.0 /100 | #301 | Tragic 89.9% |
| Immigrants | Guyana | 0.0 /100 | #302 | Tragic 89.7% |
| Immigrants | Immigrants | 0.0 /100 | #303 | Tragic 89.7% |
| Yuman | 0.0 /100 | #304 | Tragic 89.7% |
| Immigrants | Cambodia | 0.0 /100 | #305 | Tragic 89.6% |
Demographics Similar to Panamanians by 11th Grade
In terms of 11th grade, the demographic groups most similar to Panamanians are Liberian (92.3%, a difference of 0.010%), Marshallese (92.3%, a difference of 0.010%), Hawaiian (92.3%, a difference of 0.010%), Immigrants from Uganda (92.3%, a difference of 0.020%), and Samoan (92.3%, a difference of 0.020%).
| Demographics | Rating | Rank | 11th Grade |
| Immigrants | Chile | 33.3 /100 | #189 | Fair 92.4% |
| Chickasaw | 31.4 /100 | #190 | Fair 92.3% |
| French American Indians | 30.8 /100 | #191 | Fair 92.3% |
| Immigrants | Syria | 30.4 /100 | #192 | Fair 92.3% |
| Moroccans | 28.7 /100 | #193 | Fair 92.3% |
| Sioux | 28.5 /100 | #194 | Fair 92.3% |
| Liberians | 26.8 /100 | #195 | Fair 92.3% |
| Panamanians | 26.4 /100 | #196 | Fair 92.3% |
| Marshallese | 26.0 /100 | #197 | Fair 92.3% |
| Hawaiians | 25.5 /100 | #198 | Fair 92.3% |
| Immigrants | Uganda | 25.2 /100 | #199 | Fair 92.3% |
| Samoans | 25.1 /100 | #200 | Fair 92.3% |
| Immigrants | China | 25.1 /100 | #201 | Fair 92.3% |
| Immigrants | Eastern Africa | 24.1 /100 | #202 | Fair 92.3% |
| Immigrants | Sudan | 23.5 /100 | #203 | Fair 92.3% |