Immigrants from Eastern Asia vs Panamanian 11th Grade
COMPARE
Immigrants from Eastern Asia
Panamanian
11th Grade
11th Grade Comparison
Immigrants from Eastern Asia
Panamanians
92.7%
11TH GRADE
72.6/ 100
METRIC RATING
157th/ 347
METRIC RANK
92.3%
11TH GRADE
26.4/ 100
METRIC RATING
196th/ 347
METRIC RANK
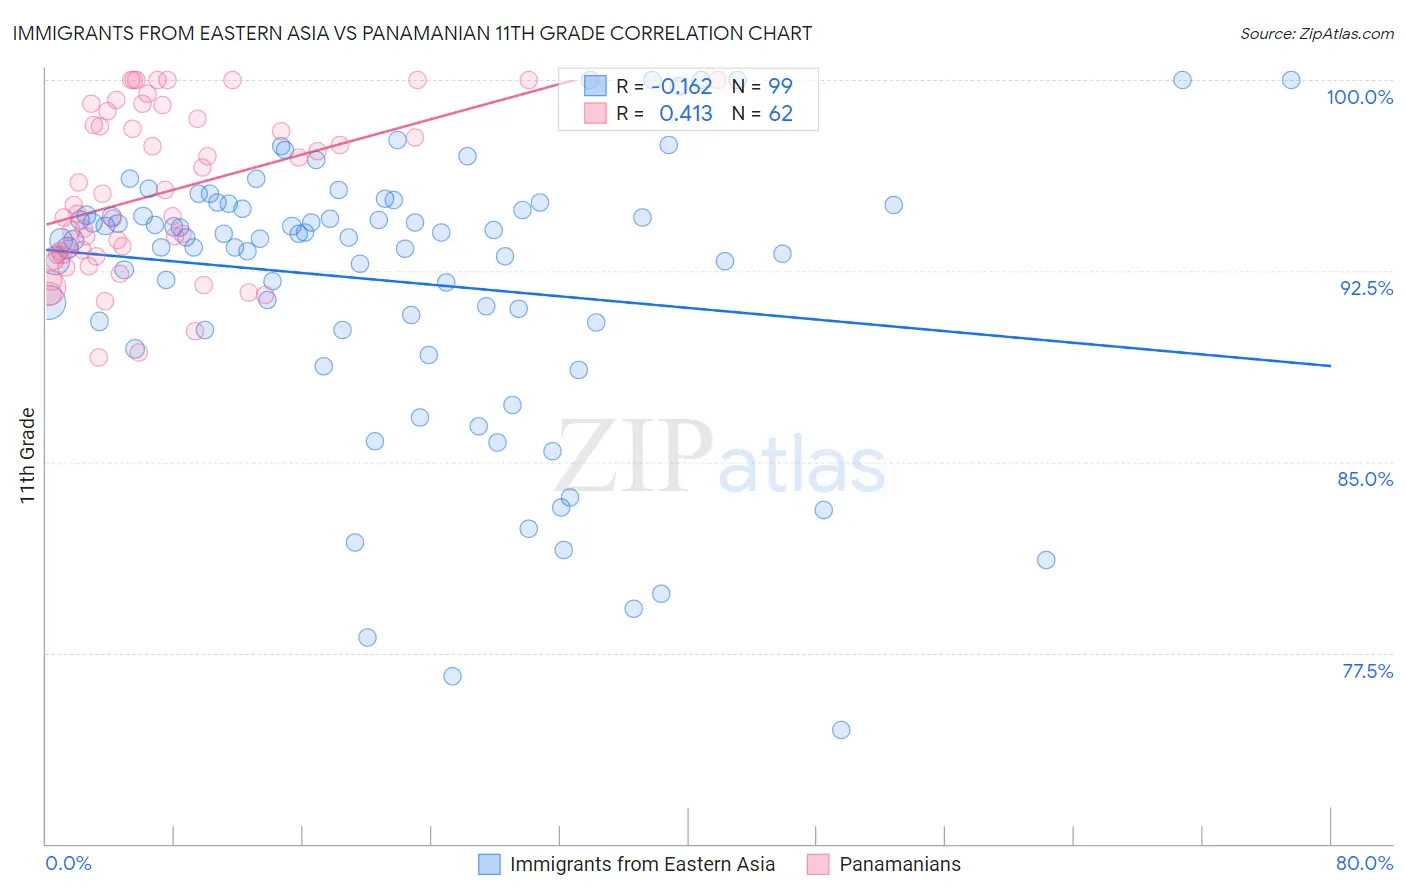
Immigrants from Eastern Asia vs Panamanian 11th Grade Correlation Chart
The statistical analysis conducted on geographies consisting of 499,846,352 people shows a poor negative correlation between the proportion of Immigrants from Eastern Asia and percentage of population with at least 11th grade education in the United States with a correlation coefficient (R) of -0.162 and weighted average of 92.7%. Similarly, the statistical analysis conducted on geographies consisting of 281,248,945 people shows a moderate positive correlation between the proportion of Panamanians and percentage of population with at least 11th grade education in the United States with a correlation coefficient (R) of 0.413 and weighted average of 92.3%, a difference of 0.49%.
11th Grade Correlation Summary
| Measurement | Immigrants from Eastern Asia | Panamanian |
| Minimum | 74.5% | 89.1% |
| Maximum | 100.0% | 100.0% |
| Range | 25.5% | 10.9% |
| Mean | 92.1% | 95.6% |
| Median | 93.8% | 94.9% |
| Interquartile 25% (IQ1) | 90.5% | 93.1% |
| Interquartile 75% (IQ3) | 95.1% | 98.5% |
| Interquartile Range (IQR) | 4.6% | 5.4% |
| Standard Deviation (Sample) | 5.4% | 3.2% |
| Standard Deviation (Population) | 5.4% | 3.1% |
Similar Demographics by 11th Grade
Demographics Similar to Immigrants from Eastern Asia by 11th Grade
In terms of 11th grade, the demographic groups most similar to Immigrants from Eastern Asia are Immigrants from Spain (92.7%, a difference of 0.0%), Osage (92.7%, a difference of 0.010%), Argentinean (92.7%, a difference of 0.010%), Immigrants from Venezuela (92.7%, a difference of 0.010%), and American (92.7%, a difference of 0.010%).
| Demographics | Rating | Rank | 11th Grade |
| Immigrants | Egypt | 77.5 /100 | #150 | Good 92.8% |
| Potawatomi | 74.3 /100 | #151 | Good 92.8% |
| Iraqis | 74.2 /100 | #152 | Good 92.8% |
| Brazilians | 73.9 /100 | #153 | Good 92.8% |
| Osage | 73.4 /100 | #154 | Good 92.7% |
| Argentineans | 73.4 /100 | #155 | Good 92.7% |
| Immigrants | Spain | 73.0 /100 | #156 | Good 92.7% |
| Immigrants | Eastern Asia | 72.6 /100 | #157 | Good 92.7% |
| Immigrants | Venezuela | 72.0 /100 | #158 | Good 92.7% |
| Americans | 71.7 /100 | #159 | Good 92.7% |
| Immigrants | Lebanon | 70.7 /100 | #160 | Good 92.7% |
| Immigrants | Argentina | 69.8 /100 | #161 | Good 92.7% |
| Paraguayans | 68.7 /100 | #162 | Good 92.7% |
| Immigrants | Nonimmigrants | 66.6 /100 | #163 | Good 92.7% |
| Spanish | 66.2 /100 | #164 | Good 92.7% |
Demographics Similar to Panamanians by 11th Grade
In terms of 11th grade, the demographic groups most similar to Panamanians are Liberian (92.3%, a difference of 0.010%), Marshallese (92.3%, a difference of 0.010%), Hawaiian (92.3%, a difference of 0.010%), Immigrants from Uganda (92.3%, a difference of 0.020%), and Samoan (92.3%, a difference of 0.020%).
| Demographics | Rating | Rank | 11th Grade |
| Immigrants | Chile | 33.3 /100 | #189 | Fair 92.4% |
| Chickasaw | 31.4 /100 | #190 | Fair 92.3% |
| French American Indians | 30.8 /100 | #191 | Fair 92.3% |
| Immigrants | Syria | 30.4 /100 | #192 | Fair 92.3% |
| Moroccans | 28.7 /100 | #193 | Fair 92.3% |
| Sioux | 28.5 /100 | #194 | Fair 92.3% |
| Liberians | 26.8 /100 | #195 | Fair 92.3% |
| Panamanians | 26.4 /100 | #196 | Fair 92.3% |
| Marshallese | 26.0 /100 | #197 | Fair 92.3% |
| Hawaiians | 25.5 /100 | #198 | Fair 92.3% |
| Immigrants | Uganda | 25.2 /100 | #199 | Fair 92.3% |
| Samoans | 25.1 /100 | #200 | Fair 92.3% |
| Immigrants | China | 25.1 /100 | #201 | Fair 92.3% |
| Immigrants | Eastern Africa | 24.1 /100 | #202 | Fair 92.3% |
| Immigrants | Sudan | 23.5 /100 | #203 | Fair 92.3% |