Puerto Rican vs Immigrants from Jamaica 11th Grade
COMPARE
Puerto Rican
Immigrants from Jamaica
11th Grade
11th Grade Comparison
Puerto Ricans
Immigrants from Jamaica
88.4%
11TH GRADE
0.0/ 100
METRIC RATING
322nd/ 347
METRIC RANK
91.2%
11TH GRADE
0.3/ 100
METRIC RATING
267th/ 347
METRIC RANK
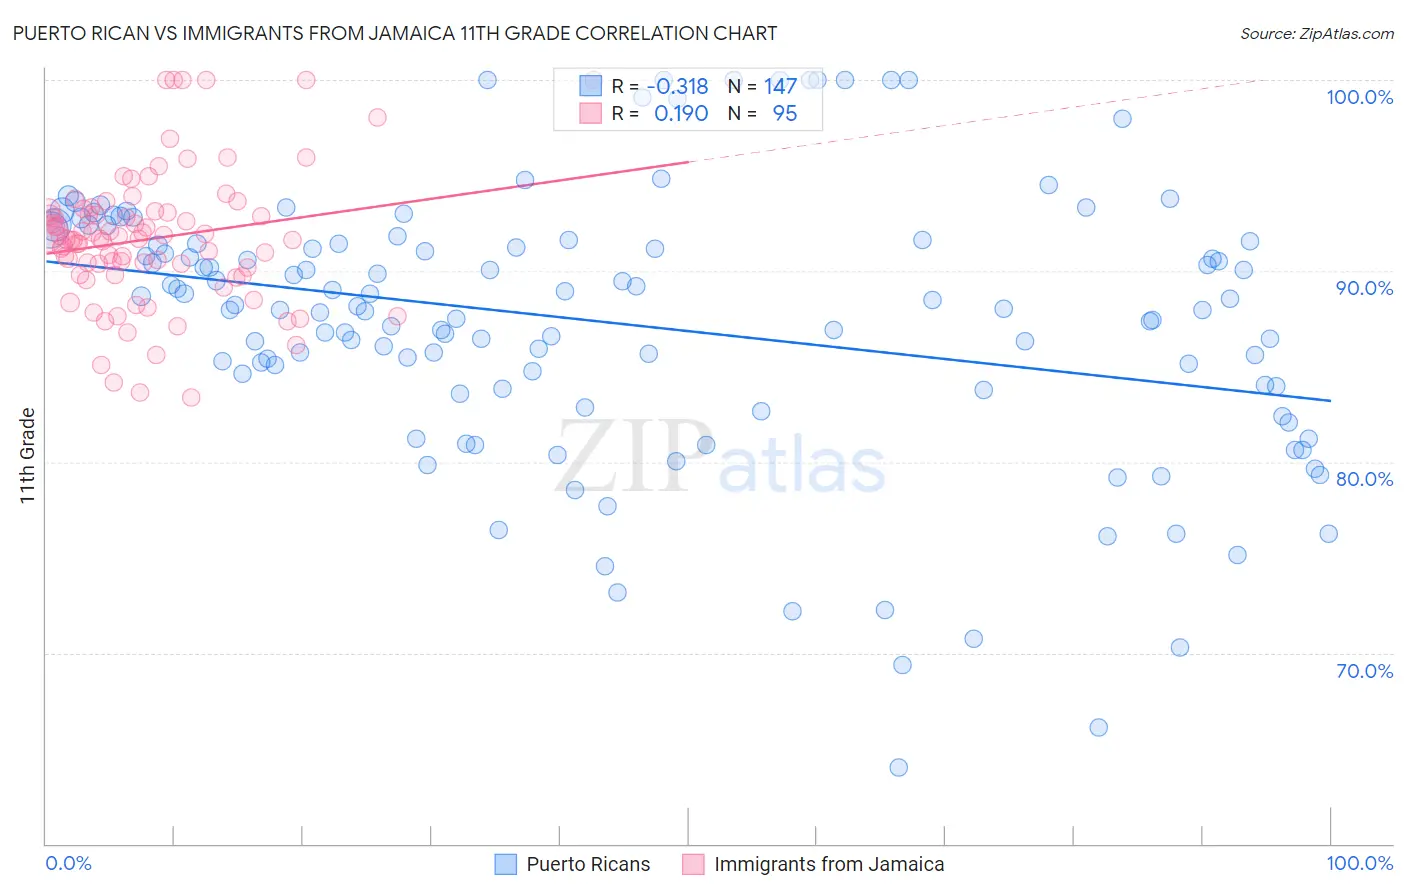
Puerto Rican vs Immigrants from Jamaica 11th Grade Correlation Chart
The statistical analysis conducted on geographies consisting of 528,320,613 people shows a mild negative correlation between the proportion of Puerto Ricans and percentage of population with at least 11th grade education in the United States with a correlation coefficient (R) of -0.318 and weighted average of 88.4%. Similarly, the statistical analysis conducted on geographies consisting of 301,829,550 people shows a poor positive correlation between the proportion of Immigrants from Jamaica and percentage of population with at least 11th grade education in the United States with a correlation coefficient (R) of 0.190 and weighted average of 91.2%, a difference of 3.2%.
11th Grade Correlation Summary
| Measurement | Puerto Rican | Immigrants from Jamaica |
| Minimum | 64.0% | 83.4% |
| Maximum | 100.0% | 100.0% |
| Range | 36.0% | 16.6% |
| Mean | 87.3% | 91.7% |
| Median | 88.0% | 91.7% |
| Interquartile 25% (IQ1) | 83.8% | 89.8% |
| Interquartile 75% (IQ3) | 91.6% | 93.2% |
| Interquartile Range (IQR) | 7.7% | 3.4% |
| Standard Deviation (Sample) | 7.1% | 3.5% |
| Standard Deviation (Population) | 7.1% | 3.5% |
Similar Demographics by 11th Grade
Demographics Similar to Puerto Ricans by 11th Grade
In terms of 11th grade, the demographic groups most similar to Puerto Ricans are Pima (88.3%, a difference of 0.080%), Central American Indian (88.2%, a difference of 0.12%), Immigrants from Nicaragua (88.1%, a difference of 0.25%), Immigrants from Belize (88.7%, a difference of 0.39%), and Immigrants from Armenia (88.8%, a difference of 0.48%).
| Demographics | Rating | Rank | 11th Grade |
| Immigrants | Ecuador | 0.0 /100 | #315 | Tragic 89.1% |
| Immigrants | Cuba | 0.0 /100 | #316 | Tragic 88.9% |
| Lumbee | 0.0 /100 | #317 | Tragic 88.9% |
| Nicaraguans | 0.0 /100 | #318 | Tragic 88.9% |
| Belizeans | 0.0 /100 | #319 | Tragic 88.8% |
| Immigrants | Armenia | 0.0 /100 | #320 | Tragic 88.8% |
| Immigrants | Belize | 0.0 /100 | #321 | Tragic 88.7% |
| Puerto Ricans | 0.0 /100 | #322 | Tragic 88.4% |
| Pima | 0.0 /100 | #323 | Tragic 88.3% |
| Central American Indians | 0.0 /100 | #324 | Tragic 88.2% |
| Immigrants | Nicaragua | 0.0 /100 | #325 | Tragic 88.1% |
| Dominicans | 0.0 /100 | #326 | Tragic 87.7% |
| Immigrants | Cabo Verde | 0.0 /100 | #327 | Tragic 87.6% |
| Tohono O'odham | 0.0 /100 | #328 | Tragic 87.6% |
| Mexican American Indians | 0.0 /100 | #329 | Tragic 87.5% |
Demographics Similar to Immigrants from Jamaica by 11th Grade
In terms of 11th grade, the demographic groups most similar to Immigrants from Jamaica are Immigrants from Western Africa (91.2%, a difference of 0.010%), Yup'ik (91.2%, a difference of 0.030%), Pueblo (91.2%, a difference of 0.030%), Immigrants from Ghana (91.2%, a difference of 0.050%), and U.S. Virgin Islander (91.1%, a difference of 0.070%).
| Demographics | Rating | Rank | 11th Grade |
| Spanish Americans | 0.6 /100 | #260 | Tragic 91.4% |
| Taiwanese | 0.6 /100 | #261 | Tragic 91.3% |
| Immigrants | Uruguay | 0.5 /100 | #262 | Tragic 91.3% |
| Immigrants | Ghana | 0.3 /100 | #263 | Tragic 91.2% |
| Yup'ik | 0.3 /100 | #264 | Tragic 91.2% |
| Pueblo | 0.3 /100 | #265 | Tragic 91.2% |
| Immigrants | Western Africa | 0.3 /100 | #266 | Tragic 91.2% |
| Immigrants | Jamaica | 0.3 /100 | #267 | Tragic 91.2% |
| U.S. Virgin Islanders | 0.2 /100 | #268 | Tragic 91.1% |
| Ute | 0.2 /100 | #269 | Tragic 91.1% |
| Trinidadians and Tobagonians | 0.2 /100 | #270 | Tragic 91.1% |
| Immigrants | Peru | 0.1 /100 | #271 | Tragic 91.0% |
| West Indians | 0.1 /100 | #272 | Tragic 91.0% |
| Paiute | 0.1 /100 | #273 | Tragic 91.0% |
| Immigrants | Trinidad and Tobago | 0.1 /100 | #274 | Tragic 90.9% |