Puerto Rican vs Cambodian 11th Grade
COMPARE
Puerto Rican
Cambodian
11th Grade
11th Grade Comparison
Puerto Ricans
Cambodians
88.4%
11TH GRADE
0.0/ 100
METRIC RATING
322nd/ 347
METRIC RANK
93.6%
11TH GRADE
99.2/ 100
METRIC RATING
88th/ 347
METRIC RANK
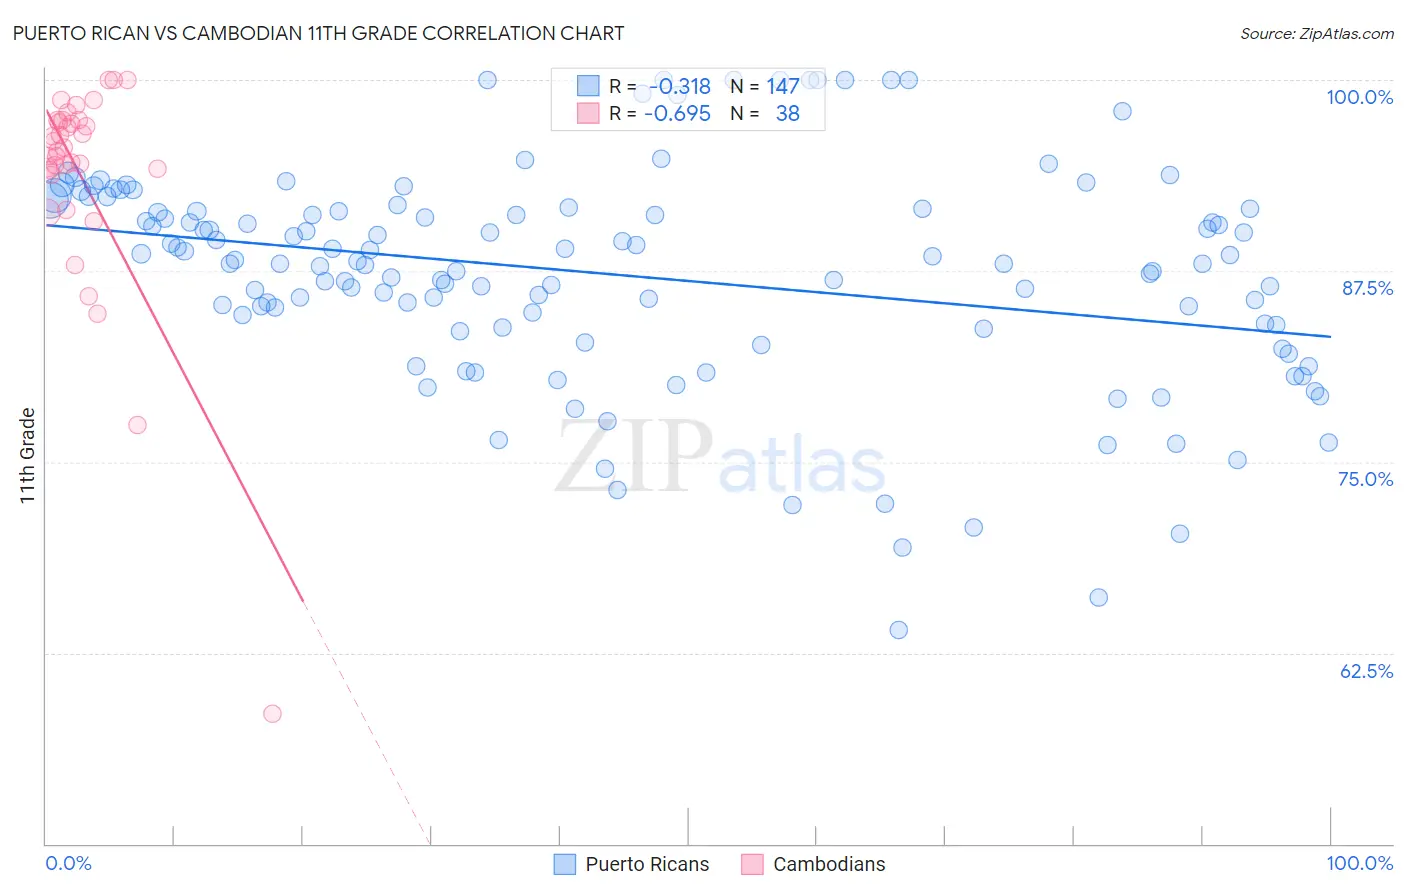
Puerto Rican vs Cambodian 11th Grade Correlation Chart
The statistical analysis conducted on geographies consisting of 528,320,613 people shows a mild negative correlation between the proportion of Puerto Ricans and percentage of population with at least 11th grade education in the United States with a correlation coefficient (R) of -0.318 and weighted average of 88.4%. Similarly, the statistical analysis conducted on geographies consisting of 102,514,976 people shows a significant negative correlation between the proportion of Cambodians and percentage of population with at least 11th grade education in the United States with a correlation coefficient (R) of -0.695 and weighted average of 93.6%, a difference of 6.0%.
11th Grade Correlation Summary
| Measurement | Puerto Rican | Cambodian |
| Minimum | 64.0% | 58.5% |
| Maximum | 100.0% | 100.0% |
| Range | 36.0% | 41.5% |
| Mean | 87.3% | 93.7% |
| Median | 88.0% | 95.5% |
| Interquartile 25% (IQ1) | 83.8% | 94.1% |
| Interquartile 75% (IQ3) | 91.6% | 97.4% |
| Interquartile Range (IQR) | 7.7% | 3.3% |
| Standard Deviation (Sample) | 7.1% | 7.4% |
| Standard Deviation (Population) | 7.1% | 7.3% |
Similar Demographics by 11th Grade
Demographics Similar to Puerto Ricans by 11th Grade
In terms of 11th grade, the demographic groups most similar to Puerto Ricans are Pima (88.3%, a difference of 0.080%), Central American Indian (88.2%, a difference of 0.12%), Immigrants from Nicaragua (88.1%, a difference of 0.25%), Immigrants from Belize (88.7%, a difference of 0.39%), and Immigrants from Armenia (88.8%, a difference of 0.48%).
| Demographics | Rating | Rank | 11th Grade |
| Immigrants | Ecuador | 0.0 /100 | #315 | Tragic 89.1% |
| Immigrants | Cuba | 0.0 /100 | #316 | Tragic 88.9% |
| Lumbee | 0.0 /100 | #317 | Tragic 88.9% |
| Nicaraguans | 0.0 /100 | #318 | Tragic 88.9% |
| Belizeans | 0.0 /100 | #319 | Tragic 88.8% |
| Immigrants | Armenia | 0.0 /100 | #320 | Tragic 88.8% |
| Immigrants | Belize | 0.0 /100 | #321 | Tragic 88.7% |
| Puerto Ricans | 0.0 /100 | #322 | Tragic 88.4% |
| Pima | 0.0 /100 | #323 | Tragic 88.3% |
| Central American Indians | 0.0 /100 | #324 | Tragic 88.2% |
| Immigrants | Nicaragua | 0.0 /100 | #325 | Tragic 88.1% |
| Dominicans | 0.0 /100 | #326 | Tragic 87.7% |
| Immigrants | Cabo Verde | 0.0 /100 | #327 | Tragic 87.6% |
| Tohono O'odham | 0.0 /100 | #328 | Tragic 87.6% |
| Mexican American Indians | 0.0 /100 | #329 | Tragic 87.5% |
Demographics Similar to Cambodians by 11th Grade
In terms of 11th grade, the demographic groups most similar to Cambodians are Immigrants from South Central Asia (93.6%, a difference of 0.0%), Immigrants from Western Europe (93.6%, a difference of 0.0%), Burmese (93.6%, a difference of 0.0%), Immigrants from Switzerland (93.6%, a difference of 0.010%), and Ottawa (93.6%, a difference of 0.010%).
| Demographics | Rating | Rank | 11th Grade |
| Immigrants | Moldova | 99.5 /100 | #81 | Exceptional 93.7% |
| Immigrants | Saudi Arabia | 99.3 /100 | #82 | Exceptional 93.7% |
| Icelanders | 99.3 /100 | #83 | Exceptional 93.6% |
| Immigrants | Taiwan | 99.3 /100 | #84 | Exceptional 93.6% |
| Immigrants | Switzerland | 99.3 /100 | #85 | Exceptional 93.6% |
| Immigrants | South Central Asia | 99.2 /100 | #86 | Exceptional 93.6% |
| Immigrants | Western Europe | 99.2 /100 | #87 | Exceptional 93.6% |
| Cambodians | 99.2 /100 | #88 | Exceptional 93.6% |
| Burmese | 99.2 /100 | #89 | Exceptional 93.6% |
| Ottawa | 99.2 /100 | #90 | Exceptional 93.6% |
| South Africans | 99.2 /100 | #91 | Exceptional 93.6% |
| Immigrants | Bulgaria | 99.1 /100 | #92 | Exceptional 93.6% |
| Puget Sound Salish | 99.1 /100 | #93 | Exceptional 93.6% |
| Swiss | 99.0 /100 | #94 | Exceptional 93.6% |
| Immigrants | France | 99.0 /100 | #95 | Exceptional 93.6% |