Puerto Rican vs Immigrants from Africa Doctorate Degree
COMPARE
Puerto Rican
Immigrants from Africa
Doctorate Degree
Doctorate Degree Comparison
Puerto Ricans
Immigrants from Africa
1.4%
DOCTORATE DEGREE
0.1/ 100
METRIC RATING
298th/ 347
METRIC RANK
2.0%
DOCTORATE DEGREE
87.0/ 100
METRIC RATING
140th/ 347
METRIC RANK
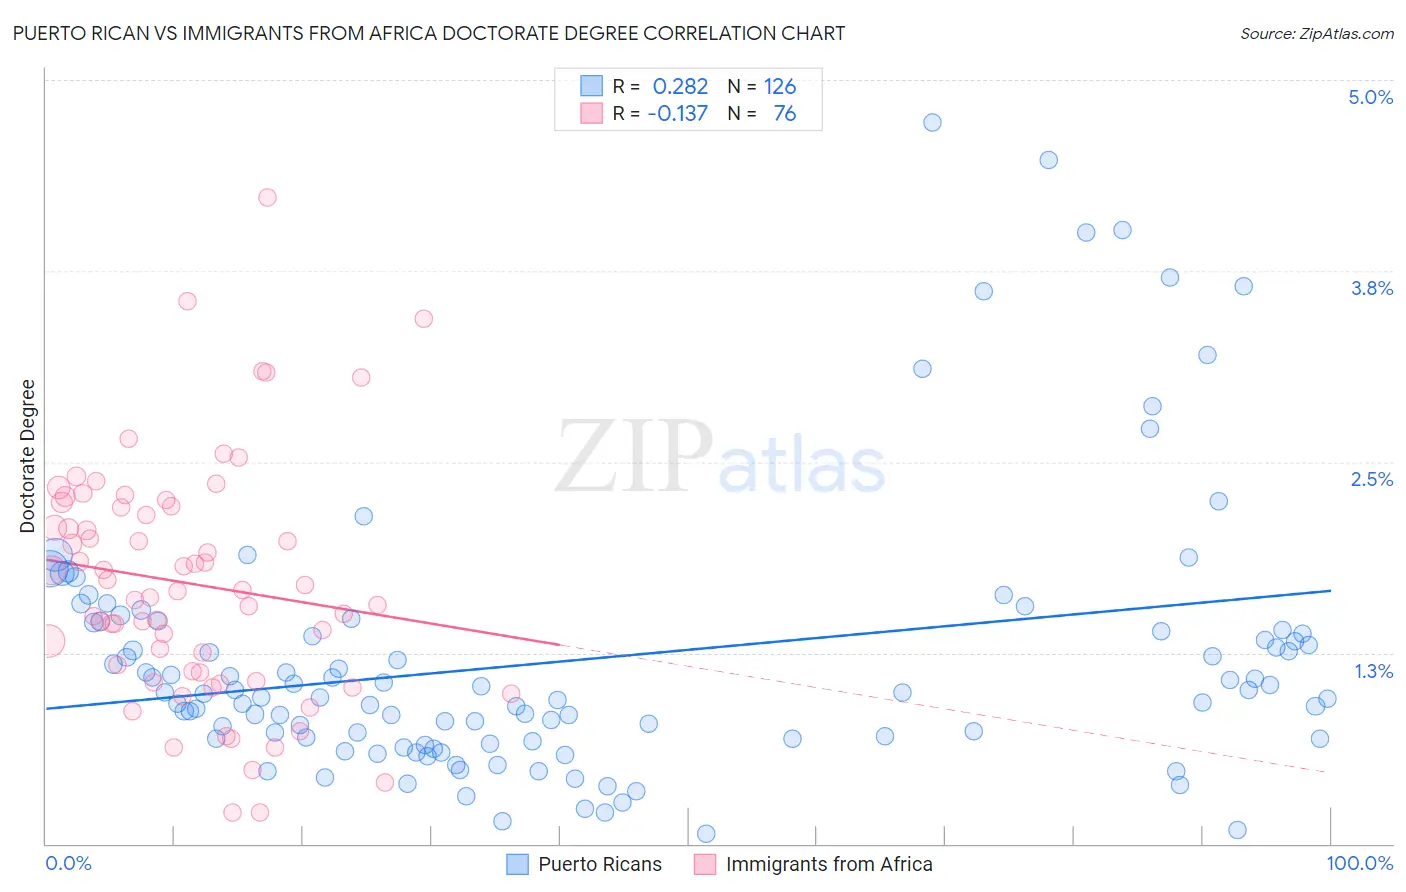
Puerto Rican vs Immigrants from Africa Doctorate Degree Correlation Chart
The statistical analysis conducted on geographies consisting of 514,802,619 people shows a weak positive correlation between the proportion of Puerto Ricans and percentage of population with at least doctorate degree education in the United States with a correlation coefficient (R) of 0.282 and weighted average of 1.4%. Similarly, the statistical analysis conducted on geographies consisting of 463,247,736 people shows a poor negative correlation between the proportion of Immigrants from Africa and percentage of population with at least doctorate degree education in the United States with a correlation coefficient (R) of -0.137 and weighted average of 2.0%, a difference of 40.5%.
Doctorate Degree Correlation Summary
| Measurement | Puerto Rican | Immigrants from Africa |
| Minimum | 0.063% | 0.20% |
| Maximum | 4.7% | 4.2% |
| Range | 4.7% | 4.0% |
| Mean | 1.2% | 1.7% |
| Median | 0.99% | 1.7% |
| Interquartile 25% (IQ1) | 0.69% | 1.1% |
| Interquartile 75% (IQ3) | 1.4% | 2.2% |
| Interquartile Range (IQR) | 0.71% | 1.1% |
| Standard Deviation (Sample) | 0.89% | 0.78% |
| Standard Deviation (Population) | 0.89% | 0.77% |
Similar Demographics by Doctorate Degree
Demographics Similar to Puerto Ricans by Doctorate Degree
In terms of doctorate degree, the demographic groups most similar to Puerto Ricans are Tsimshian (1.4%, a difference of 0.41%), Belizean (1.4%, a difference of 0.43%), Immigrants from Ecuador (1.4%, a difference of 0.63%), Immigrants from Guatemala (1.4%, a difference of 0.76%), and Honduran (1.4%, a difference of 0.83%).
| Demographics | Rating | Rank | Doctorate Degree |
| Blacks/African Americans | 0.3 /100 | #291 | Tragic 1.4% |
| Alaska Natives | 0.3 /100 | #292 | Tragic 1.4% |
| Immigrants | Yemen | 0.2 /100 | #293 | Tragic 1.4% |
| Samoans | 0.2 /100 | #294 | Tragic 1.4% |
| Guatemalans | 0.2 /100 | #295 | Tragic 1.4% |
| Immigrants | Ecuador | 0.2 /100 | #296 | Tragic 1.4% |
| Tsimshian | 0.2 /100 | #297 | Tragic 1.4% |
| Puerto Ricans | 0.1 /100 | #298 | Tragic 1.4% |
| Belizeans | 0.1 /100 | #299 | Tragic 1.4% |
| Immigrants | Guatemala | 0.1 /100 | #300 | Tragic 1.4% |
| Hondurans | 0.1 /100 | #301 | Tragic 1.4% |
| Shoshone | 0.1 /100 | #302 | Tragic 1.4% |
| Immigrants | Dominica | 0.1 /100 | #303 | Tragic 1.4% |
| Mexican American Indians | 0.1 /100 | #304 | Tragic 1.4% |
| Pennsylvania Germans | 0.1 /100 | #305 | Tragic 1.4% |
Demographics Similar to Immigrants from Africa by Doctorate Degree
In terms of doctorate degree, the demographic groups most similar to Immigrants from Africa are Senegalese (2.0%, a difference of 0.070%), Afghan (2.0%, a difference of 0.080%), Italian (2.0%, a difference of 0.28%), Swiss (2.0%, a difference of 0.31%), and South American Indian (2.0%, a difference of 0.40%).
| Demographics | Rating | Rank | Doctorate Degree |
| Immigrants | Uzbekistan | 89.3 /100 | #133 | Excellent 2.0% |
| Immigrants | Cameroon | 88.9 /100 | #134 | Excellent 2.0% |
| Serbians | 88.7 /100 | #135 | Excellent 2.0% |
| Swedes | 88.3 /100 | #136 | Excellent 2.0% |
| South American Indians | 88.3 /100 | #137 | Excellent 2.0% |
| Swiss | 88.0 /100 | #138 | Excellent 2.0% |
| Afghans | 87.2 /100 | #139 | Excellent 2.0% |
| Immigrants | Africa | 87.0 /100 | #140 | Excellent 2.0% |
| Senegalese | 86.7 /100 | #141 | Excellent 2.0% |
| Italians | 86.0 /100 | #142 | Excellent 2.0% |
| Sierra Leoneans | 85.1 /100 | #143 | Excellent 2.0% |
| Immigrants | Moldova | 84.3 /100 | #144 | Excellent 2.0% |
| Kenyans | 83.6 /100 | #145 | Excellent 1.9% |
| Immigrants | Syria | 83.6 /100 | #146 | Excellent 1.9% |
| Immigrants | Senegal | 82.5 /100 | #147 | Excellent 1.9% |