Puerto Rican vs Immigrants from Albania Doctorate Degree
COMPARE
Puerto Rican
Immigrants from Albania
Doctorate Degree
Doctorate Degree Comparison
Puerto Ricans
Immigrants from Albania
1.4%
DOCTORATE DEGREE
0.1/ 100
METRIC RATING
298th/ 347
METRIC RANK
1.9%
DOCTORATE DEGREE
72.8/ 100
METRIC RATING
154th/ 347
METRIC RANK
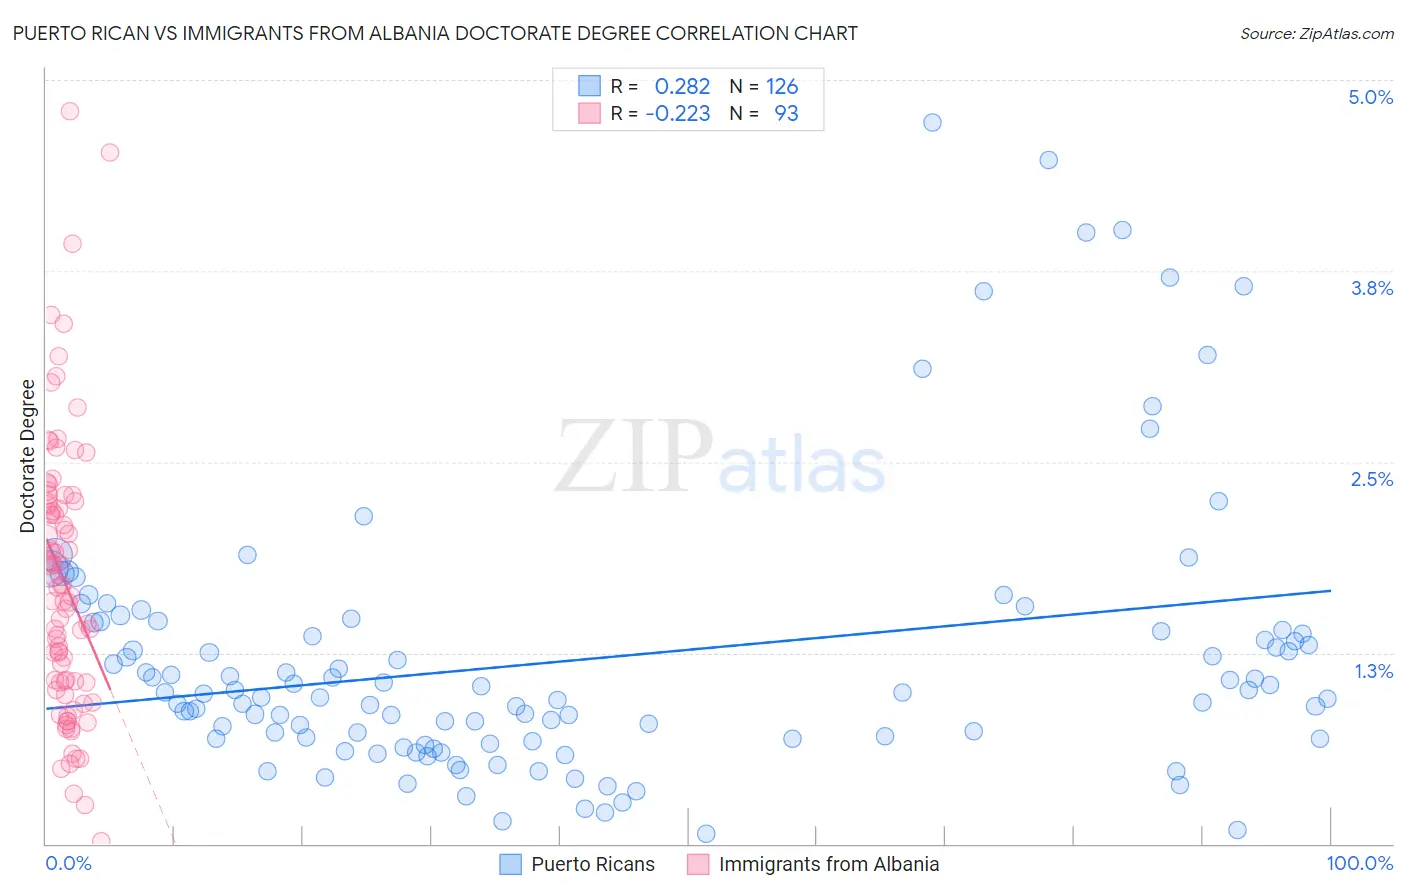
Puerto Rican vs Immigrants from Albania Doctorate Degree Correlation Chart
The statistical analysis conducted on geographies consisting of 514,802,619 people shows a weak positive correlation between the proportion of Puerto Ricans and percentage of population with at least doctorate degree education in the United States with a correlation coefficient (R) of 0.282 and weighted average of 1.4%. Similarly, the statistical analysis conducted on geographies consisting of 119,213,784 people shows a weak negative correlation between the proportion of Immigrants from Albania and percentage of population with at least doctorate degree education in the United States with a correlation coefficient (R) of -0.223 and weighted average of 1.9%, a difference of 36.1%.
Doctorate Degree Correlation Summary
| Measurement | Puerto Rican | Immigrants from Albania |
| Minimum | 0.063% | 0.013% |
| Maximum | 4.7% | 4.8% |
| Range | 4.7% | 4.8% |
| Mean | 1.2% | 1.7% |
| Median | 0.99% | 1.7% |
| Interquartile 25% (IQ1) | 0.69% | 1.1% |
| Interquartile 75% (IQ3) | 1.4% | 2.2% |
| Interquartile Range (IQR) | 0.71% | 1.2% |
| Standard Deviation (Sample) | 0.89% | 0.90% |
| Standard Deviation (Population) | 0.89% | 0.89% |
Similar Demographics by Doctorate Degree
Demographics Similar to Puerto Ricans by Doctorate Degree
In terms of doctorate degree, the demographic groups most similar to Puerto Ricans are Tsimshian (1.4%, a difference of 0.41%), Belizean (1.4%, a difference of 0.43%), Immigrants from Ecuador (1.4%, a difference of 0.63%), Immigrants from Guatemala (1.4%, a difference of 0.76%), and Honduran (1.4%, a difference of 0.83%).
| Demographics | Rating | Rank | Doctorate Degree |
| Blacks/African Americans | 0.3 /100 | #291 | Tragic 1.4% |
| Alaska Natives | 0.3 /100 | #292 | Tragic 1.4% |
| Immigrants | Yemen | 0.2 /100 | #293 | Tragic 1.4% |
| Samoans | 0.2 /100 | #294 | Tragic 1.4% |
| Guatemalans | 0.2 /100 | #295 | Tragic 1.4% |
| Immigrants | Ecuador | 0.2 /100 | #296 | Tragic 1.4% |
| Tsimshian | 0.2 /100 | #297 | Tragic 1.4% |
| Puerto Ricans | 0.1 /100 | #298 | Tragic 1.4% |
| Belizeans | 0.1 /100 | #299 | Tragic 1.4% |
| Immigrants | Guatemala | 0.1 /100 | #300 | Tragic 1.4% |
| Hondurans | 0.1 /100 | #301 | Tragic 1.4% |
| Shoshone | 0.1 /100 | #302 | Tragic 1.4% |
| Immigrants | Dominica | 0.1 /100 | #303 | Tragic 1.4% |
| Mexican American Indians | 0.1 /100 | #304 | Tragic 1.4% |
| Pennsylvania Germans | 0.1 /100 | #305 | Tragic 1.4% |
Demographics Similar to Immigrants from Albania by Doctorate Degree
In terms of doctorate degree, the demographic groups most similar to Immigrants from Albania are Polish (1.9%, a difference of 0.020%), Slavic (1.9%, a difference of 0.080%), Danish (1.9%, a difference of 0.16%), Hungarian (1.9%, a difference of 0.19%), and Immigrants from Oceania (1.9%, a difference of 0.22%).
| Demographics | Rating | Rank | Doctorate Degree |
| Immigrants | Senegal | 82.5 /100 | #147 | Excellent 1.9% |
| Luxembourgers | 81.1 /100 | #148 | Excellent 1.9% |
| Basques | 76.9 /100 | #149 | Good 1.9% |
| English | 75.9 /100 | #150 | Good 1.9% |
| Albanians | 74.8 /100 | #151 | Good 1.9% |
| Immigrants | Kenya | 74.3 /100 | #152 | Good 1.9% |
| Immigrants | Oceania | 74.0 /100 | #153 | Good 1.9% |
| Immigrants | Albania | 72.8 /100 | #154 | Good 1.9% |
| Poles | 72.7 /100 | #155 | Good 1.9% |
| Slavs | 72.4 /100 | #156 | Good 1.9% |
| Danes | 71.9 /100 | #157 | Good 1.9% |
| Hungarians | 71.7 /100 | #158 | Good 1.9% |
| Slovenes | 70.2 /100 | #159 | Good 1.9% |
| Welsh | 69.7 /100 | #160 | Good 1.9% |
| Immigrants | Middle Africa | 68.8 /100 | #161 | Good 1.9% |