Mongolian vs Apache 8th Grade
COMPARE
Mongolian
Apache
8th Grade
8th Grade Comparison
Mongolians
Apache
95.8%
8TH GRADE
53.0/ 100
METRIC RATING
173rd/ 347
METRIC RANK
95.5%
8TH GRADE
19.4/ 100
METRIC RATING
202nd/ 347
METRIC RANK
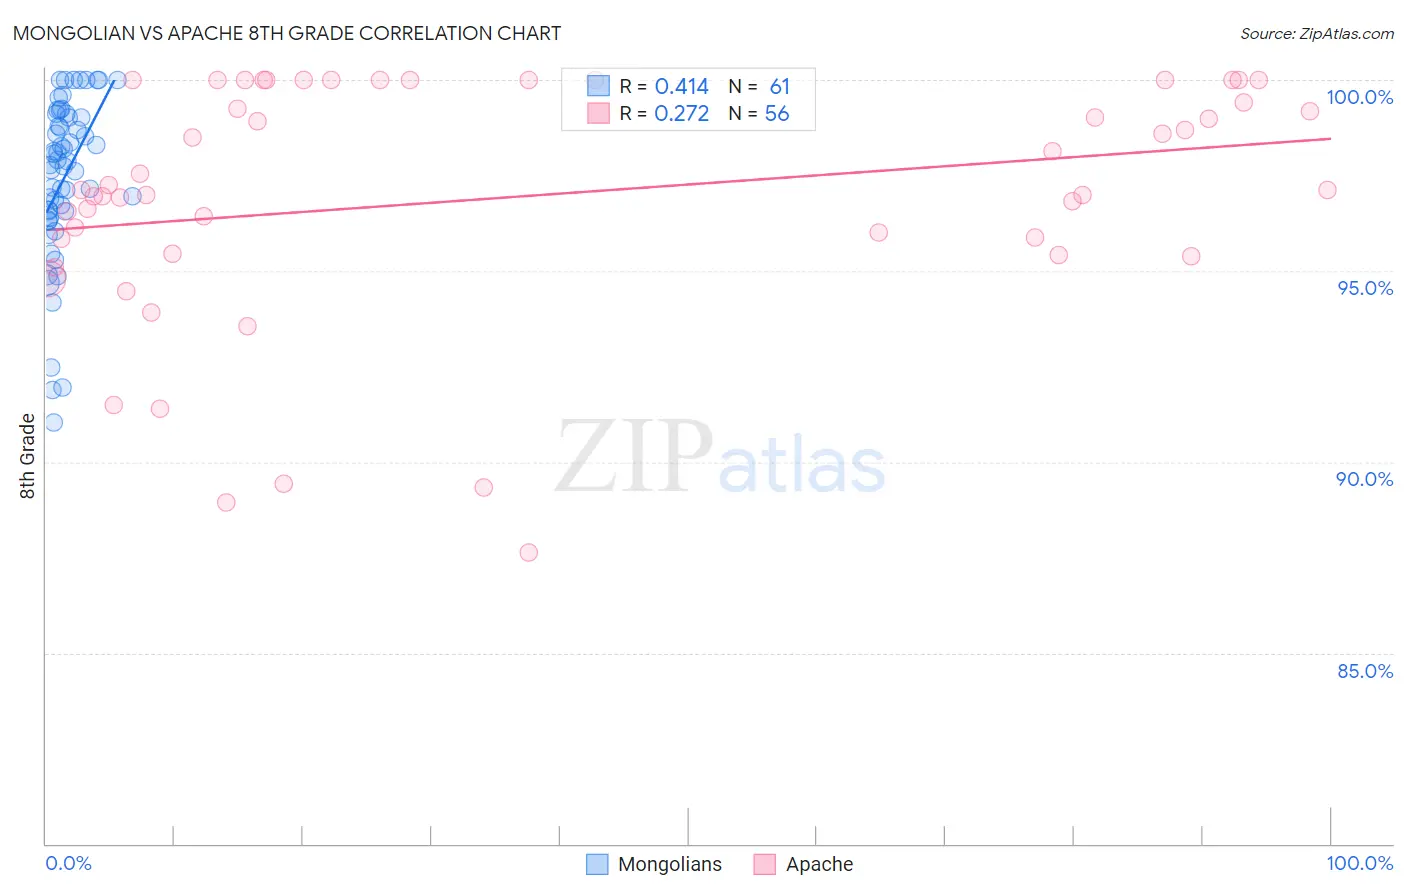
Mongolian vs Apache 8th Grade Correlation Chart
The statistical analysis conducted on geographies consisting of 140,362,004 people shows a moderate positive correlation between the proportion of Mongolians and percentage of population with at least 8th grade education in the United States with a correlation coefficient (R) of 0.414 and weighted average of 95.8%. Similarly, the statistical analysis conducted on geographies consisting of 231,143,094 people shows a weak positive correlation between the proportion of Apache and percentage of population with at least 8th grade education in the United States with a correlation coefficient (R) of 0.272 and weighted average of 95.5%, a difference of 0.25%.
8th Grade Correlation Summary
| Measurement | Mongolian | Apache |
| Minimum | 91.0% | 87.6% |
| Maximum | 100.0% | 100.0% |
| Range | 9.0% | 12.4% |
| Mean | 97.4% | 96.9% |
| Median | 97.9% | 97.1% |
| Interquartile 25% (IQ1) | 96.5% | 95.7% |
| Interquartile 75% (IQ3) | 99.1% | 100.0% |
| Interquartile Range (IQR) | 2.6% | 4.3% |
| Standard Deviation (Sample) | 2.1% | 3.2% |
| Standard Deviation (Population) | 2.1% | 3.1% |
Similar Demographics by 8th Grade
Demographics Similar to Mongolians by 8th Grade
In terms of 8th grade, the demographic groups most similar to Mongolians are Chilean (95.7%, a difference of 0.020%), Immigrants from Albania (95.7%, a difference of 0.020%), Egyptian (95.8%, a difference of 0.030%), Immigrants from Korea (95.8%, a difference of 0.030%), and Pakistani (95.7%, a difference of 0.030%).
| Demographics | Rating | Rank | 8th Grade |
| Immigrants | Poland | 61.1 /100 | #166 | Good 95.8% |
| Spaniards | 60.0 /100 | #167 | Good 95.8% |
| Immigrants | Ukraine | 59.5 /100 | #168 | Average 95.8% |
| Immigrants | Iran | 58.6 /100 | #169 | Average 95.8% |
| Ute | 58.5 /100 | #170 | Average 95.8% |
| Egyptians | 58.2 /100 | #171 | Average 95.8% |
| Immigrants | Korea | 57.9 /100 | #172 | Average 95.8% |
| Mongolians | 53.0 /100 | #173 | Average 95.8% |
| Chileans | 50.0 /100 | #174 | Average 95.7% |
| Immigrants | Albania | 49.6 /100 | #175 | Average 95.7% |
| Pakistanis | 48.8 /100 | #176 | Average 95.7% |
| Marshallese | 47.6 /100 | #177 | Average 95.7% |
| Venezuelans | 47.5 /100 | #178 | Average 95.7% |
| Immigrants | Brazil | 45.4 /100 | #179 | Average 95.7% |
| Iraqis | 40.5 /100 | #180 | Average 95.7% |
Demographics Similar to Apache by 8th Grade
In terms of 8th grade, the demographic groups most similar to Apache are Immigrants from Argentina (95.5%, a difference of 0.010%), Moroccan (95.5%, a difference of 0.020%), Paraguayan (95.5%, a difference of 0.030%), Immigrants from Northern Africa (95.5%, a difference of 0.030%), and Argentinean (95.5%, a difference of 0.030%).
| Demographics | Rating | Rank | 8th Grade |
| Immigrants | Zaire | 25.2 /100 | #195 | Fair 95.6% |
| Assyrians/Chaldeans/Syriacs | 24.5 /100 | #196 | Fair 95.6% |
| Sierra Leoneans | 24.3 /100 | #197 | Fair 95.6% |
| Paraguayans | 22.6 /100 | #198 | Fair 95.5% |
| Immigrants | Northern Africa | 22.5 /100 | #199 | Fair 95.5% |
| Argentineans | 22.2 /100 | #200 | Fair 95.5% |
| Immigrants | Argentina | 20.6 /100 | #201 | Fair 95.5% |
| Apache | 19.4 /100 | #202 | Poor 95.5% |
| Moroccans | 17.4 /100 | #203 | Poor 95.5% |
| Hawaiians | 16.7 /100 | #204 | Poor 95.5% |
| Immigrants | Bahamas | 16.7 /100 | #205 | Poor 95.5% |
| Comanche | 16.3 /100 | #206 | Poor 95.5% |
| Immigrants | Sudan | 15.1 /100 | #207 | Poor 95.5% |
| Portuguese | 14.3 /100 | #208 | Poor 95.5% |
| Immigrants | Lebanon | 13.7 /100 | #209 | Poor 95.4% |