Pueblo vs Immigrants from Somalia Doctorate Degree
COMPARE
Pueblo
Immigrants from Somalia
Doctorate Degree
Doctorate Degree Comparison
Pueblo
Immigrants from Somalia
1.7%
DOCTORATE DEGREE
14.2/ 100
METRIC RATING
214th/ 347
METRIC RANK
1.8%
DOCTORATE DEGREE
25.4/ 100
METRIC RATING
195th/ 347
METRIC RANK
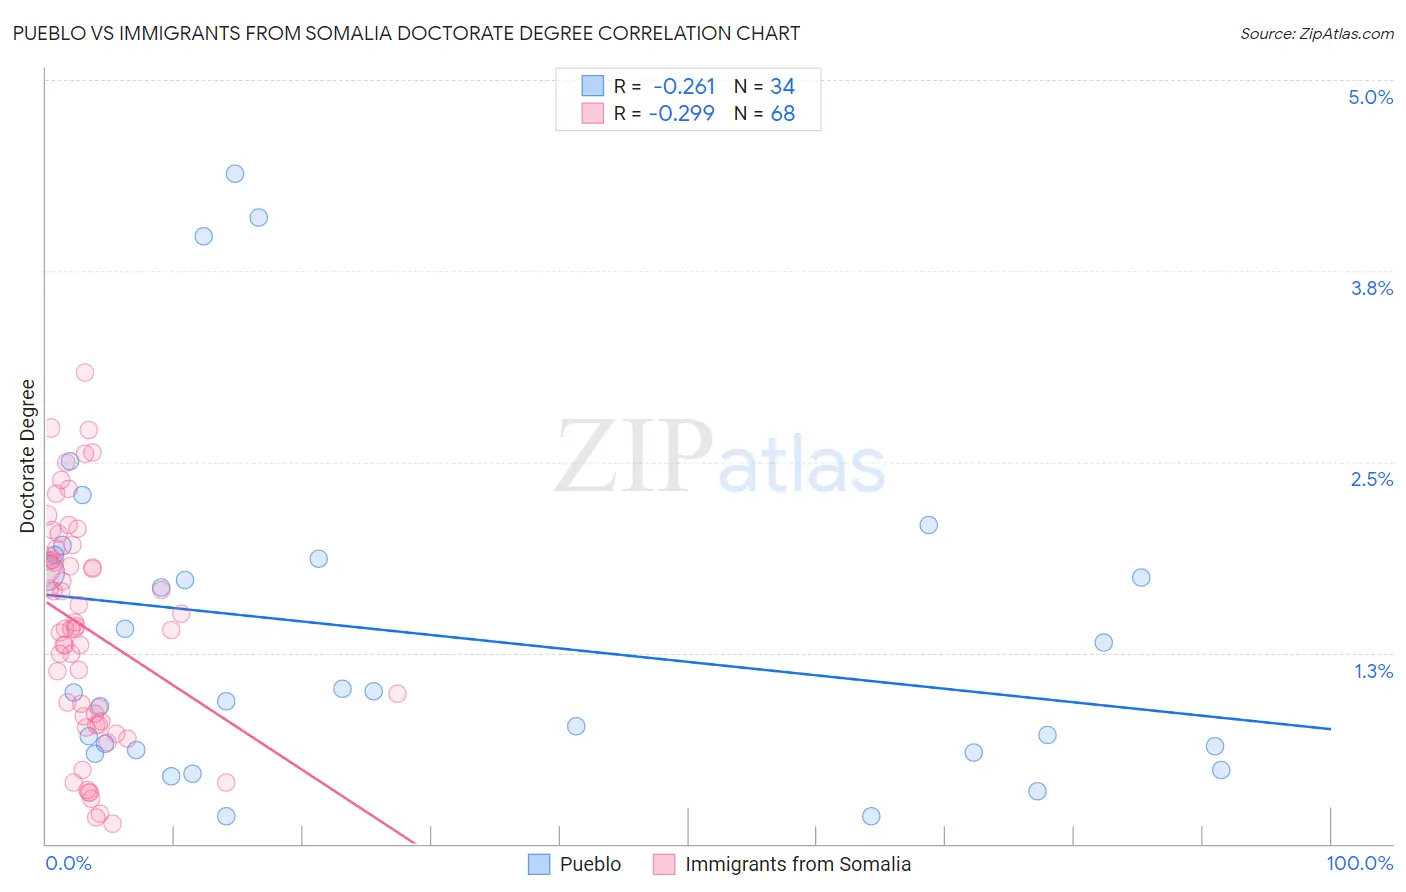
Pueblo vs Immigrants from Somalia Doctorate Degree Correlation Chart
The statistical analysis conducted on geographies consisting of 119,278,004 people shows a weak negative correlation between the proportion of Pueblo and percentage of population with at least doctorate degree education in the United States with a correlation coefficient (R) of -0.261 and weighted average of 1.7%. Similarly, the statistical analysis conducted on geographies consisting of 91,934,011 people shows a weak negative correlation between the proportion of Immigrants from Somalia and percentage of population with at least doctorate degree education in the United States with a correlation coefficient (R) of -0.299 and weighted average of 1.8%, a difference of 2.8%.
Doctorate Degree Correlation Summary
| Measurement | Pueblo | Immigrants from Somalia |
| Minimum | 0.18% | 0.13% |
| Maximum | 4.4% | 3.1% |
| Range | 4.2% | 3.0% |
| Mean | 1.4% | 1.4% |
| Median | 0.99% | 1.4% |
| Interquartile 25% (IQ1) | 0.62% | 0.82% |
| Interquartile 75% (IQ3) | 1.9% | 1.9% |
| Interquartile Range (IQR) | 1.3% | 1.1% |
| Standard Deviation (Sample) | 1.1% | 0.72% |
| Standard Deviation (Population) | 1.1% | 0.71% |
Demographics Similar to Pueblo and Immigrants from Somalia by Doctorate Degree
In terms of doctorate degree, the demographic groups most similar to Pueblo are Korean (1.7%, a difference of 0.010%), Immigrants from South Eastern Asia (1.7%, a difference of 0.15%), Immigrants from Armenia (1.7%, a difference of 0.28%), Tongan (1.7%, a difference of 0.29%), and Immigrants from Western Africa (1.7%, a difference of 0.38%). Similarly, the demographic groups most similar to Immigrants from Somalia are Subsaharan African (1.8%, a difference of 0.070%), Chinese (1.8%, a difference of 0.070%), Uruguayan (1.8%, a difference of 0.15%), Immigrants from Ghana (1.8%, a difference of 0.16%), and Immigrants from South America (1.8%, a difference of 0.45%).
| Demographics | Rating | Rank | Doctorate Degree |
| Uruguayans | 26.2 /100 | #194 | Fair 1.8% |
| Immigrants | Somalia | 25.4 /100 | #195 | Fair 1.8% |
| Sub-Saharan Africans | 25.1 /100 | #196 | Fair 1.8% |
| Chinese | 25.1 /100 | #197 | Fair 1.8% |
| Immigrants | Ghana | 24.6 /100 | #198 | Fair 1.8% |
| Immigrants | South America | 23.3 /100 | #199 | Fair 1.8% |
| Whites/Caucasians | 22.8 /100 | #200 | Fair 1.8% |
| Immigrants | Nigeria | 22.4 /100 | #201 | Fair 1.8% |
| Portuguese | 21.4 /100 | #202 | Fair 1.8% |
| Immigrants | Vietnam | 21.4 /100 | #203 | Fair 1.8% |
| Somalis | 21.2 /100 | #204 | Fair 1.7% |
| Venezuelans | 19.5 /100 | #205 | Poor 1.7% |
| Immigrants | Peru | 17.6 /100 | #206 | Poor 1.7% |
| Yugoslavians | 17.1 /100 | #207 | Poor 1.7% |
| Colombians | 16.1 /100 | #208 | Poor 1.7% |
| Immigrants | Western Africa | 15.4 /100 | #209 | Poor 1.7% |
| Tongans | 15.1 /100 | #210 | Poor 1.7% |
| Immigrants | Armenia | 15.1 /100 | #211 | Poor 1.7% |
| Immigrants | South Eastern Asia | 14.7 /100 | #212 | Poor 1.7% |
| Koreans | 14.2 /100 | #213 | Poor 1.7% |
| Pueblo | 14.2 /100 | #214 | Poor 1.7% |