Pueblo vs Alaskan Athabascan Doctorate Degree
COMPARE
Pueblo
Alaskan Athabascan
Doctorate Degree
Doctorate Degree Comparison
Pueblo
Alaskan Athabascans
1.7%
DOCTORATE DEGREE
14.2/ 100
METRIC RATING
214th/ 347
METRIC RANK
1.7%
DOCTORATE DEGREE
13.8/ 100
METRIC RATING
215th/ 347
METRIC RANK
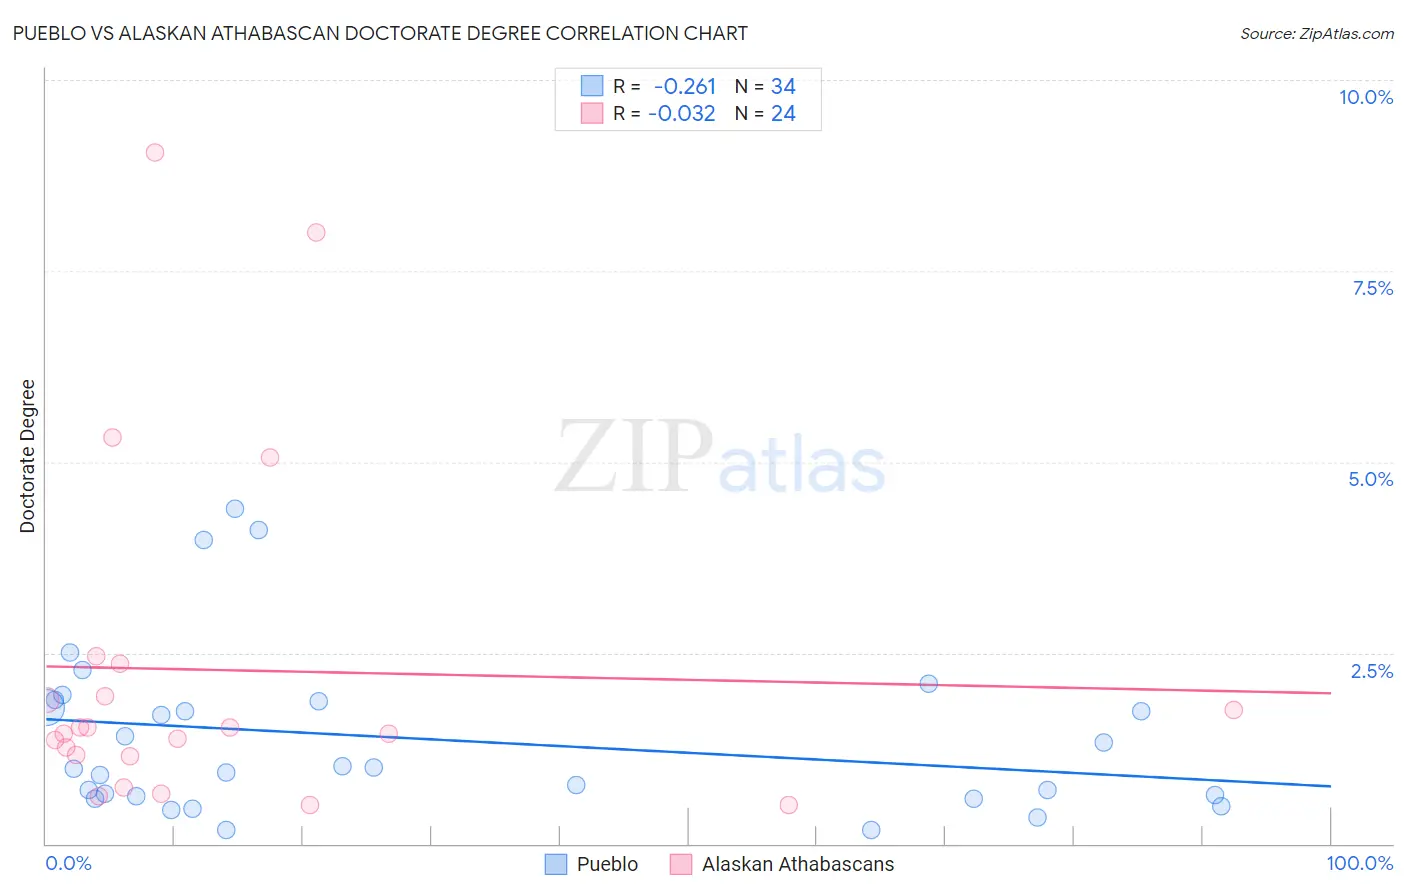
Pueblo vs Alaskan Athabascan Doctorate Degree Correlation Chart
The statistical analysis conducted on geographies consisting of 119,278,004 people shows a weak negative correlation between the proportion of Pueblo and percentage of population with at least doctorate degree education in the United States with a correlation coefficient (R) of -0.261 and weighted average of 1.7%. Similarly, the statistical analysis conducted on geographies consisting of 45,553,512 people shows no correlation between the proportion of Alaskan Athabascans and percentage of population with at least doctorate degree education in the United States with a correlation coefficient (R) of -0.032 and weighted average of 1.7%, a difference of 0.14%.
Doctorate Degree Correlation Summary
| Measurement | Pueblo | Alaskan Athabascan |
| Minimum | 0.18% | 0.51% |
| Maximum | 4.4% | 9.0% |
| Range | 4.2% | 8.5% |
| Mean | 1.4% | 2.3% |
| Median | 0.99% | 1.5% |
| Interquartile 25% (IQ1) | 0.62% | 1.2% |
| Interquartile 75% (IQ3) | 1.9% | 2.1% |
| Interquartile Range (IQR) | 1.3% | 0.98% |
| Standard Deviation (Sample) | 1.1% | 2.3% |
| Standard Deviation (Population) | 1.1% | 2.2% |
Demographics Similar to Pueblo and Alaskan Athabascans by Doctorate Degree
In terms of doctorate degree, the demographic groups most similar to Pueblo are Korean (1.7%, a difference of 0.010%), Immigrants from South Eastern Asia (1.7%, a difference of 0.15%), Immigrants from Burma/Myanmar (1.7%, a difference of 0.24%), Immigrants from Armenia (1.7%, a difference of 0.28%), and Tongan (1.7%, a difference of 0.29%). Similarly, the demographic groups most similar to Alaskan Athabascans are Immigrants from Burma/Myanmar (1.7%, a difference of 0.10%), Korean (1.7%, a difference of 0.15%), Immigrants from South Eastern Asia (1.7%, a difference of 0.29%), Spanish American (1.7%, a difference of 0.31%), and Immigrants from Armenia (1.7%, a difference of 0.42%).
| Demographics | Rating | Rank | Doctorate Degree |
| Somalis | 21.2 /100 | #204 | Fair 1.7% |
| Venezuelans | 19.5 /100 | #205 | Poor 1.7% |
| Immigrants | Peru | 17.6 /100 | #206 | Poor 1.7% |
| Yugoslavians | 17.1 /100 | #207 | Poor 1.7% |
| Colombians | 16.1 /100 | #208 | Poor 1.7% |
| Immigrants | Western Africa | 15.4 /100 | #209 | Poor 1.7% |
| Tongans | 15.1 /100 | #210 | Poor 1.7% |
| Immigrants | Armenia | 15.1 /100 | #211 | Poor 1.7% |
| Immigrants | South Eastern Asia | 14.7 /100 | #212 | Poor 1.7% |
| Koreans | 14.2 /100 | #213 | Poor 1.7% |
| Pueblo | 14.2 /100 | #214 | Poor 1.7% |
| Alaskan Athabascans | 13.8 /100 | #215 | Poor 1.7% |
| Immigrants | Burma/Myanmar | 13.5 /100 | #216 | Poor 1.7% |
| Spanish Americans | 12.9 /100 | #217 | Poor 1.7% |
| Tlingit-Haida | 11.9 /100 | #218 | Poor 1.7% |
| Immigrants | Iraq | 10.7 /100 | #219 | Poor 1.7% |
| Immigrants | Uruguay | 9.2 /100 | #220 | Tragic 1.7% |
| Immigrants | Nonimmigrants | 8.8 /100 | #221 | Tragic 1.7% |
| Immigrants | Venezuela | 8.7 /100 | #222 | Tragic 1.7% |
| Immigrants | Bosnia and Herzegovina | 7.8 /100 | #223 | Tragic 1.7% |
| Immigrants | Poland | 7.4 /100 | #224 | Tragic 1.7% |