Pueblo vs Estonian GED/Equivalency
COMPARE
Pueblo
Estonian
GED/Equivalency
GED/Equivalency Comparison
Pueblo
Estonians
82.3%
GED/EQUIVALENCY
0.0/ 100
METRIC RATING
288th/ 347
METRIC RANK
88.6%
GED/EQUIVALENCY
99.8/ 100
METRIC RATING
25th/ 347
METRIC RANK
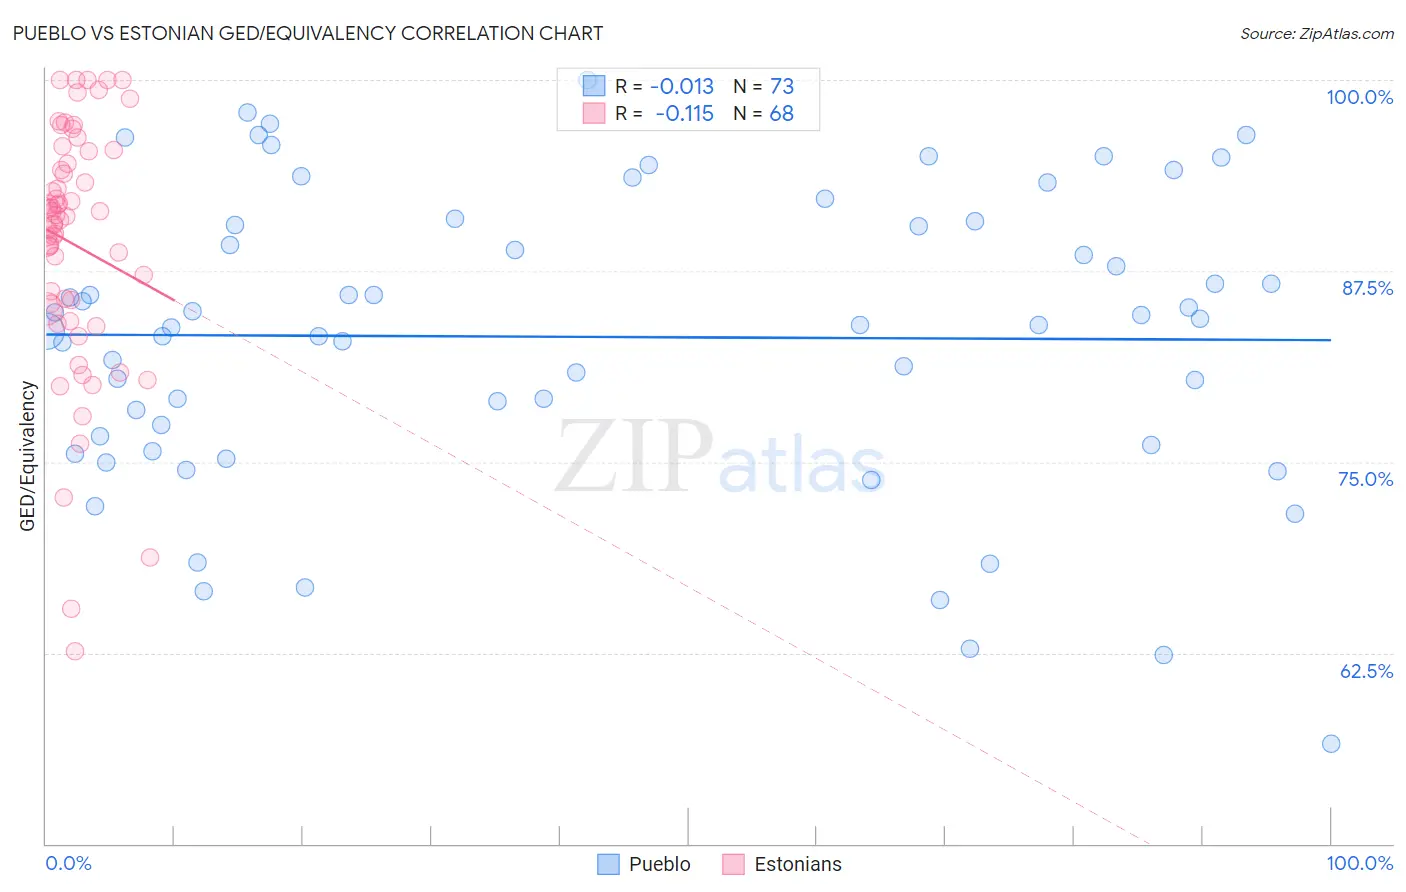
Pueblo vs Estonian GED/Equivalency Correlation Chart
The statistical analysis conducted on geographies consisting of 120,086,468 people shows no correlation between the proportion of Pueblo and percentage of population with at least ged/equivalency education in the United States with a correlation coefficient (R) of -0.013 and weighted average of 82.3%. Similarly, the statistical analysis conducted on geographies consisting of 123,527,724 people shows a poor negative correlation between the proportion of Estonians and percentage of population with at least ged/equivalency education in the United States with a correlation coefficient (R) of -0.115 and weighted average of 88.6%, a difference of 7.6%.
GED/Equivalency Correlation Summary
| Measurement | Pueblo | Estonian |
| Minimum | 56.5% | 62.6% |
| Maximum | 100.0% | 100.0% |
| Range | 43.5% | 37.4% |
| Mean | 83.2% | 89.2% |
| Median | 84.0% | 91.0% |
| Interquartile 25% (IQ1) | 76.4% | 85.2% |
| Interquartile 75% (IQ3) | 90.6% | 94.9% |
| Interquartile Range (IQR) | 14.2% | 9.8% |
| Standard Deviation (Sample) | 9.6% | 8.1% |
| Standard Deviation (Population) | 9.6% | 8.1% |
Similar Demographics by GED/Equivalency
Demographics Similar to Pueblo by GED/Equivalency
In terms of ged/equivalency, the demographic groups most similar to Pueblo are Immigrants from Cambodia (82.2%, a difference of 0.080%), Japanese (82.4%, a difference of 0.10%), Immigrants from West Indies (82.4%, a difference of 0.12%), Cajun (82.4%, a difference of 0.14%), and Immigrants from Barbados (82.4%, a difference of 0.17%).
| Demographics | Rating | Rank | GED/Equivalency |
| Sioux | 0.1 /100 | #281 | Tragic 82.6% |
| Immigrants | Immigrants | 0.1 /100 | #282 | Tragic 82.6% |
| Indonesians | 0.1 /100 | #283 | Tragic 82.5% |
| Immigrants | Barbados | 0.1 /100 | #284 | Tragic 82.4% |
| Cajuns | 0.0 /100 | #285 | Tragic 82.4% |
| Immigrants | West Indies | 0.0 /100 | #286 | Tragic 82.4% |
| Japanese | 0.0 /100 | #287 | Tragic 82.4% |
| Pueblo | 0.0 /100 | #288 | Tragic 82.3% |
| Immigrants | Cambodia | 0.0 /100 | #289 | Tragic 82.2% |
| Haitians | 0.0 /100 | #290 | Tragic 82.1% |
| Cubans | 0.0 /100 | #291 | Tragic 82.0% |
| Paiute | 0.0 /100 | #292 | Tragic 82.0% |
| British West Indians | 0.0 /100 | #293 | Tragic 82.0% |
| Immigrants | St. Vincent and the Grenadines | 0.0 /100 | #294 | Tragic 82.0% |
| Nepalese | 0.0 /100 | #295 | Tragic 81.9% |
Demographics Similar to Estonians by GED/Equivalency
In terms of ged/equivalency, the demographic groups most similar to Estonians are Russian (88.6%, a difference of 0.0%), Slovak (88.6%, a difference of 0.0%), Immigrants from Australia (88.6%, a difference of 0.0%), Immigrants from Ireland (88.6%, a difference of 0.020%), and Luxembourger (88.6%, a difference of 0.030%).
| Demographics | Rating | Rank | GED/Equivalency |
| Slovenes | 99.9 /100 | #18 | Exceptional 88.8% |
| Swedes | 99.9 /100 | #19 | Exceptional 88.8% |
| Maltese | 99.9 /100 | #20 | Exceptional 88.6% |
| Luxembourgers | 99.8 /100 | #21 | Exceptional 88.6% |
| Immigrants | Ireland | 99.8 /100 | #22 | Exceptional 88.6% |
| Russians | 99.8 /100 | #23 | Exceptional 88.6% |
| Slovaks | 99.8 /100 | #24 | Exceptional 88.6% |
| Estonians | 99.8 /100 | #25 | Exceptional 88.6% |
| Immigrants | Australia | 99.8 /100 | #26 | Exceptional 88.6% |
| Immigrants | Lithuania | 99.8 /100 | #27 | Exceptional 88.6% |
| Immigrants | Northern Europe | 99.8 /100 | #28 | Exceptional 88.5% |
| Poles | 99.8 /100 | #29 | Exceptional 88.5% |
| Turks | 99.8 /100 | #30 | Exceptional 88.5% |
| Bhutanese | 99.8 /100 | #31 | Exceptional 88.4% |
| Danes | 99.8 /100 | #32 | Exceptional 88.4% |