Alsatian vs Immigrants from Egypt Bachelor's Degree
COMPARE
Alsatian
Immigrants from Egypt
Bachelor's Degree
Bachelor's Degree Comparison
Alsatians
Immigrants from Egypt
41.0%
BACHELOR'S DEGREE
97.0/ 100
METRIC RATING
106th/ 347
METRIC RANK
42.6%
BACHELOR'S DEGREE
99.4/ 100
METRIC RATING
76th/ 347
METRIC RANK
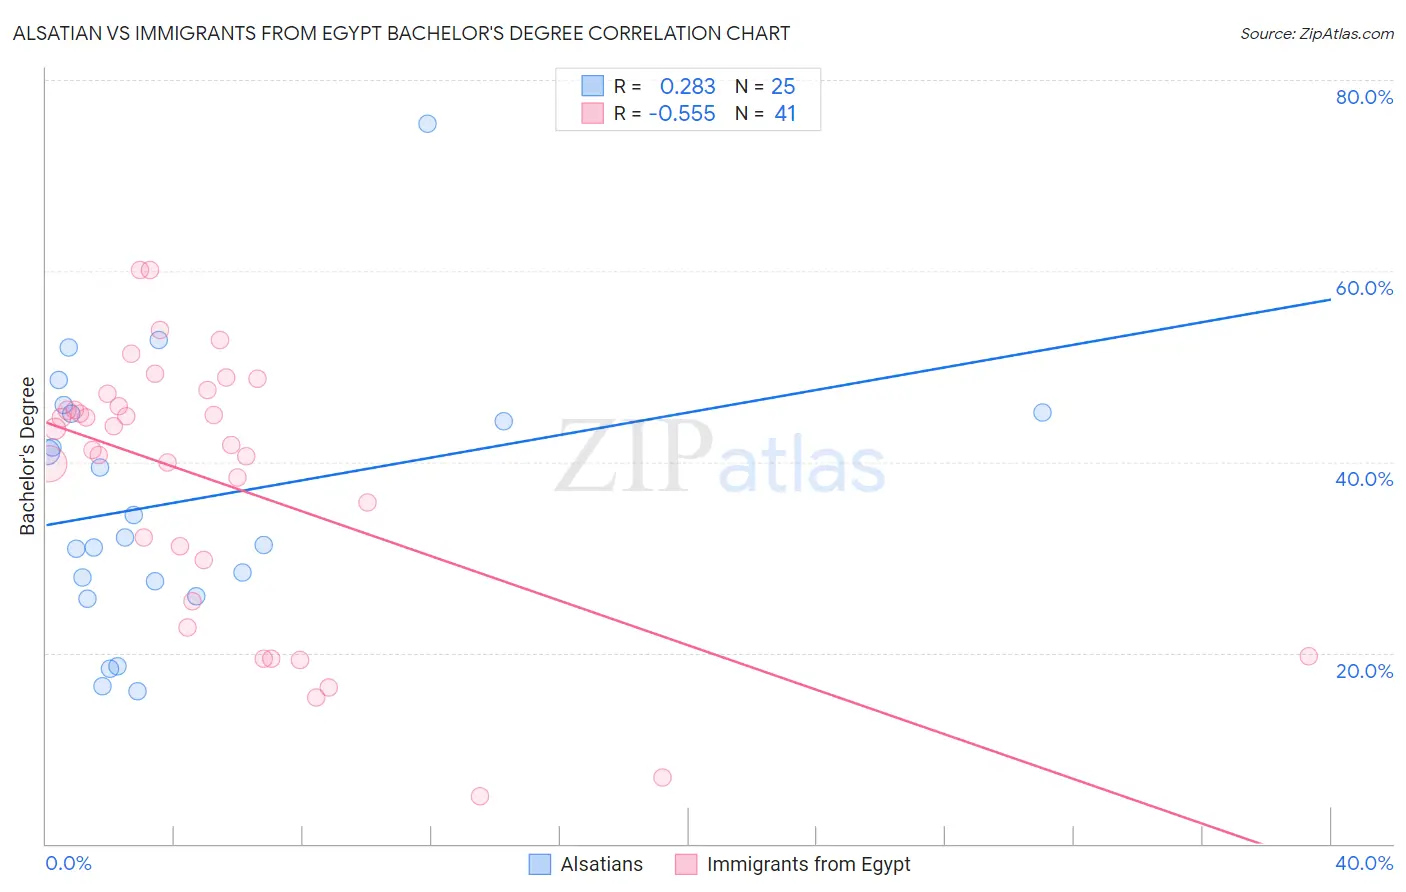
Alsatian vs Immigrants from Egypt Bachelor's Degree Correlation Chart
The statistical analysis conducted on geographies consisting of 82,682,365 people shows a weak positive correlation between the proportion of Alsatians and percentage of population with at least bachelor's degree education in the United States with a correlation coefficient (R) of 0.283 and weighted average of 41.0%. Similarly, the statistical analysis conducted on geographies consisting of 245,484,715 people shows a substantial negative correlation between the proportion of Immigrants from Egypt and percentage of population with at least bachelor's degree education in the United States with a correlation coefficient (R) of -0.555 and weighted average of 42.6%, a difference of 3.7%.
Bachelor's Degree Correlation Summary
| Measurement | Alsatian | Immigrants from Egypt |
| Minimum | 16.0% | 5.0% |
| Maximum | 75.4% | 60.1% |
| Range | 59.4% | 55.1% |
| Mean | 35.8% | 37.8% |
| Median | 32.1% | 41.8% |
| Interquartile 25% (IQ1) | 26.7% | 27.6% |
| Interquartile 75% (IQ3) | 45.1% | 46.5% |
| Interquartile Range (IQR) | 18.4% | 19.0% |
| Standard Deviation (Sample) | 13.8% | 13.8% |
| Standard Deviation (Population) | 13.5% | 13.6% |
Similar Demographics by Bachelor's Degree
Demographics Similar to Alsatians by Bachelor's Degree
In terms of bachelor's degree, the demographic groups most similar to Alsatians are Northern European (41.0%, a difference of 0.17%), Syrian (41.1%, a difference of 0.26%), Jordanian (41.2%, a difference of 0.29%), Ukrainian (40.9%, a difference of 0.31%), and Arab (40.9%, a difference of 0.33%).
| Demographics | Rating | Rank | Bachelor's Degree |
| Immigrants | England | 98.1 /100 | #99 | Exceptional 41.4% |
| Macedonians | 98.1 /100 | #100 | Exceptional 41.4% |
| Immigrants | Morocco | 98.0 /100 | #101 | Exceptional 41.4% |
| Immigrants | Italy | 97.8 /100 | #102 | Exceptional 41.3% |
| Chileans | 97.5 /100 | #103 | Exceptional 41.2% |
| Jordanians | 97.4 /100 | #104 | Exceptional 41.2% |
| Syrians | 97.4 /100 | #105 | Exceptional 41.1% |
| Alsatians | 97.0 /100 | #106 | Exceptional 41.0% |
| Northern Europeans | 96.8 /100 | #107 | Exceptional 41.0% |
| Ukrainians | 96.6 /100 | #108 | Exceptional 40.9% |
| Arabs | 96.6 /100 | #109 | Exceptional 40.9% |
| Albanians | 96.5 /100 | #110 | Exceptional 40.9% |
| Immigrants | Chile | 96.4 /100 | #111 | Exceptional 40.8% |
| Ugandans | 96.3 /100 | #112 | Exceptional 40.8% |
| Brazilians | 96.3 /100 | #113 | Exceptional 40.8% |
Demographics Similar to Immigrants from Egypt by Bachelor's Degree
In terms of bachelor's degree, the demographic groups most similar to Immigrants from Egypt are Immigrants from Zimbabwe (42.6%, a difference of 0.020%), Immigrants from Eastern Europe (42.5%, a difference of 0.18%), Bhutanese (42.7%, a difference of 0.23%), Immigrants from Ethiopia (42.5%, a difference of 0.24%), and Immigrants from Lebanon (42.4%, a difference of 0.40%).
| Demographics | Rating | Rank | Bachelor's Degree |
| Immigrants | Pakistan | 99.7 /100 | #69 | Exceptional 43.1% |
| Immigrants | Romania | 99.6 /100 | #70 | Exceptional 42.9% |
| Immigrants | Argentina | 99.6 /100 | #71 | Exceptional 42.8% |
| Ethiopians | 99.5 /100 | #72 | Exceptional 42.8% |
| Immigrants | Uzbekistan | 99.5 /100 | #73 | Exceptional 42.8% |
| Bhutanese | 99.5 /100 | #74 | Exceptional 42.7% |
| Immigrants | Zimbabwe | 99.4 /100 | #75 | Exceptional 42.6% |
| Immigrants | Egypt | 99.4 /100 | #76 | Exceptional 42.6% |
| Immigrants | Eastern Europe | 99.4 /100 | #77 | Exceptional 42.5% |
| Immigrants | Ethiopia | 99.4 /100 | #78 | Exceptional 42.5% |
| Immigrants | Lebanon | 99.3 /100 | #79 | Exceptional 42.4% |
| Immigrants | Croatia | 99.2 /100 | #80 | Exceptional 42.3% |
| Immigrants | Hungary | 99.2 /100 | #81 | Exceptional 42.3% |
| Immigrants | Scotland | 99.2 /100 | #82 | Exceptional 42.3% |
| Armenians | 99.2 /100 | #83 | Exceptional 42.3% |