Taiwanese vs Immigrants from Egypt Bachelor's Degree
COMPARE
Taiwanese
Immigrants from Egypt
Bachelor's Degree
Bachelor's Degree Comparison
Taiwanese
Immigrants from Egypt
40.0%
BACHELOR'S DEGREE
91.1/ 100
METRIC RATING
132nd/ 347
METRIC RANK
42.6%
BACHELOR'S DEGREE
99.4/ 100
METRIC RATING
76th/ 347
METRIC RANK
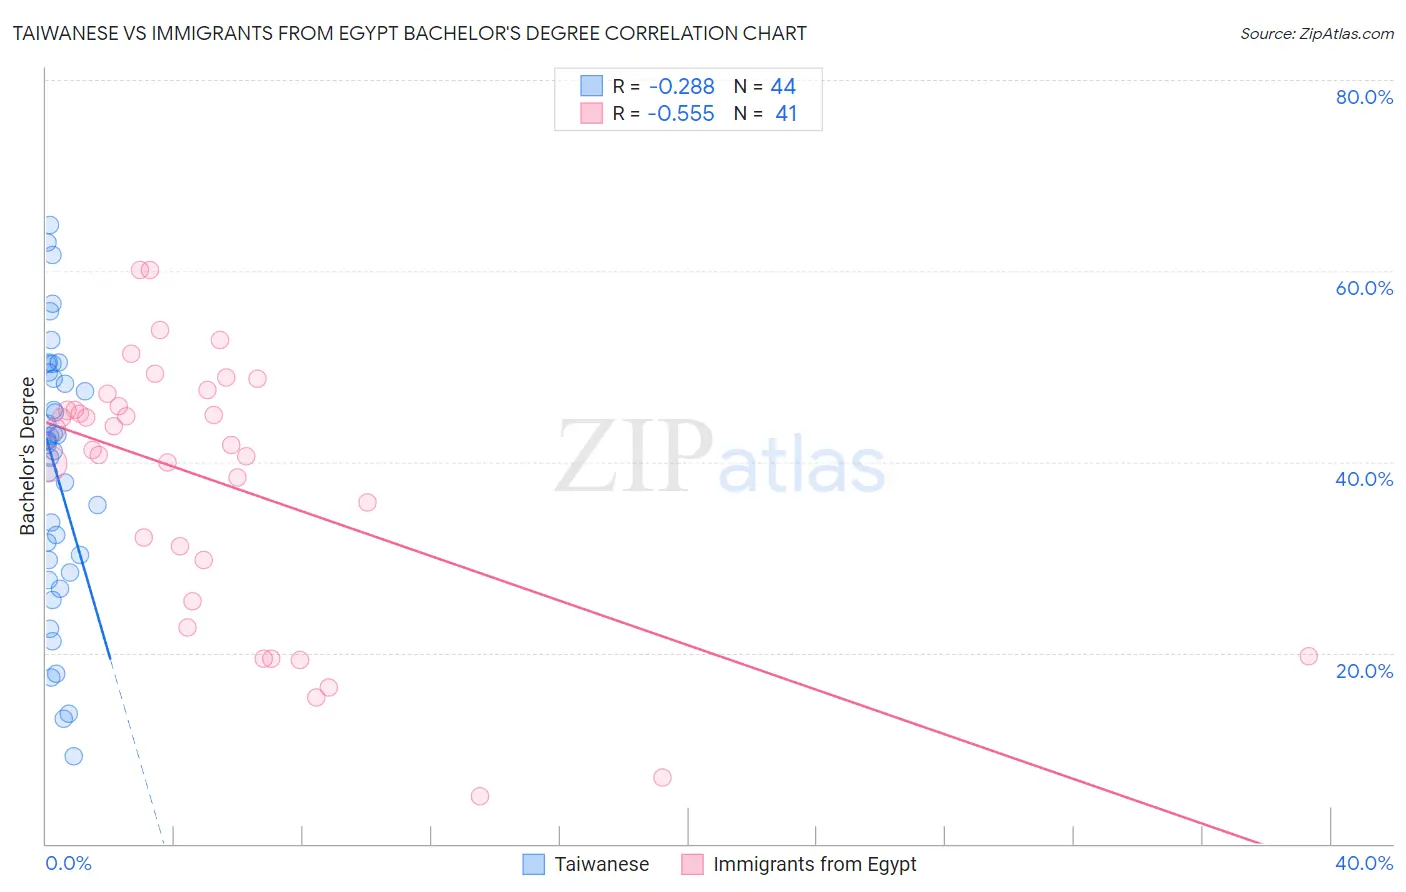
Taiwanese vs Immigrants from Egypt Bachelor's Degree Correlation Chart
The statistical analysis conducted on geographies consisting of 31,724,936 people shows a weak negative correlation between the proportion of Taiwanese and percentage of population with at least bachelor's degree education in the United States with a correlation coefficient (R) of -0.288 and weighted average of 40.0%. Similarly, the statistical analysis conducted on geographies consisting of 245,484,715 people shows a substantial negative correlation between the proportion of Immigrants from Egypt and percentage of population with at least bachelor's degree education in the United States with a correlation coefficient (R) of -0.555 and weighted average of 42.6%, a difference of 6.5%.
Bachelor's Degree Correlation Summary
| Measurement | Taiwanese | Immigrants from Egypt |
| Minimum | 9.1% | 5.0% |
| Maximum | 64.8% | 60.1% |
| Range | 55.7% | 55.1% |
| Mean | 38.9% | 37.8% |
| Median | 42.0% | 41.8% |
| Interquartile 25% (IQ1) | 29.1% | 27.6% |
| Interquartile 75% (IQ3) | 49.0% | 46.5% |
| Interquartile Range (IQR) | 20.0% | 19.0% |
| Standard Deviation (Sample) | 13.8% | 13.8% |
| Standard Deviation (Population) | 13.6% | 13.6% |
Similar Demographics by Bachelor's Degree
Demographics Similar to Taiwanese by Bachelor's Degree
In terms of bachelor's degree, the demographic groups most similar to Taiwanese are Immigrants from Southern Europe (40.0%, a difference of 0.010%), Italian (40.1%, a difference of 0.25%), Sierra Leonean (40.1%, a difference of 0.33%), Serbian (40.1%, a difference of 0.40%), and Assyrian/Chaldean/Syriac (39.8%, a difference of 0.44%).
| Demographics | Rating | Rank | Bachelor's Degree |
| British | 94.2 /100 | #125 | Exceptional 40.4% |
| Immigrants | Eastern Africa | 94.1 /100 | #126 | Exceptional 40.4% |
| Immigrants | Jordan | 93.4 /100 | #127 | Exceptional 40.3% |
| Immigrants | Venezuela | 92.9 /100 | #128 | Exceptional 40.2% |
| Serbians | 92.4 /100 | #129 | Exceptional 40.1% |
| Sierra Leoneans | 92.2 /100 | #130 | Exceptional 40.1% |
| Italians | 91.9 /100 | #131 | Exceptional 40.1% |
| Taiwanese | 91.1 /100 | #132 | Exceptional 40.0% |
| Immigrants | Southern Europe | 91.1 /100 | #133 | Exceptional 40.0% |
| Assyrians/Chaldeans/Syriacs | 89.4 /100 | #134 | Excellent 39.8% |
| Luxembourgers | 89.1 /100 | #135 | Excellent 39.8% |
| Pakistanis | 88.2 /100 | #136 | Excellent 39.7% |
| Icelanders | 86.5 /100 | #137 | Excellent 39.5% |
| Europeans | 85.6 /100 | #138 | Excellent 39.5% |
| Immigrants | Sudan | 84.5 /100 | #139 | Excellent 39.4% |
Demographics Similar to Immigrants from Egypt by Bachelor's Degree
In terms of bachelor's degree, the demographic groups most similar to Immigrants from Egypt are Immigrants from Zimbabwe (42.6%, a difference of 0.020%), Immigrants from Eastern Europe (42.5%, a difference of 0.18%), Bhutanese (42.7%, a difference of 0.23%), Immigrants from Ethiopia (42.5%, a difference of 0.24%), and Immigrants from Lebanon (42.4%, a difference of 0.40%).
| Demographics | Rating | Rank | Bachelor's Degree |
| Immigrants | Pakistan | 99.7 /100 | #69 | Exceptional 43.1% |
| Immigrants | Romania | 99.6 /100 | #70 | Exceptional 42.9% |
| Immigrants | Argentina | 99.6 /100 | #71 | Exceptional 42.8% |
| Ethiopians | 99.5 /100 | #72 | Exceptional 42.8% |
| Immigrants | Uzbekistan | 99.5 /100 | #73 | Exceptional 42.8% |
| Bhutanese | 99.5 /100 | #74 | Exceptional 42.7% |
| Immigrants | Zimbabwe | 99.4 /100 | #75 | Exceptional 42.6% |
| Immigrants | Egypt | 99.4 /100 | #76 | Exceptional 42.6% |
| Immigrants | Eastern Europe | 99.4 /100 | #77 | Exceptional 42.5% |
| Immigrants | Ethiopia | 99.4 /100 | #78 | Exceptional 42.5% |
| Immigrants | Lebanon | 99.3 /100 | #79 | Exceptional 42.4% |
| Immigrants | Croatia | 99.2 /100 | #80 | Exceptional 42.3% |
| Immigrants | Hungary | 99.2 /100 | #81 | Exceptional 42.3% |
| Immigrants | Scotland | 99.2 /100 | #82 | Exceptional 42.3% |
| Armenians | 99.2 /100 | #83 | Exceptional 42.3% |