Potawatomi vs Immigrants from Nicaragua Professional Degree
COMPARE
Potawatomi
Immigrants from Nicaragua
Professional Degree
Professional Degree Comparison
Potawatomi
Immigrants from Nicaragua
3.6%
PROFESSIONAL DEGREE
0.5/ 100
METRIC RATING
274th/ 347
METRIC RANK
3.7%
PROFESSIONAL DEGREE
1.4/ 100
METRIC RATING
251st/ 347
METRIC RANK
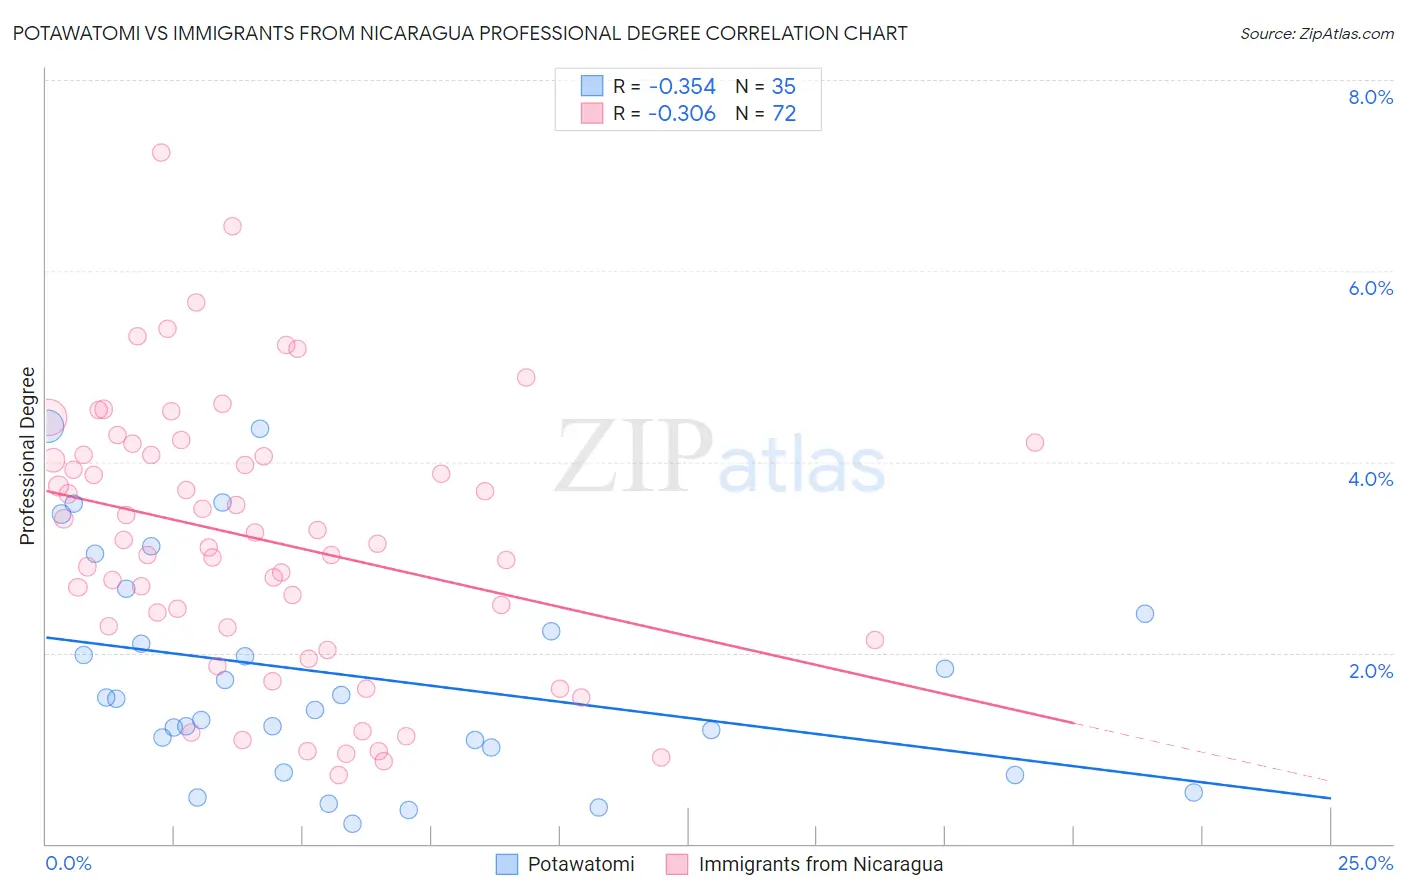
Potawatomi vs Immigrants from Nicaragua Professional Degree Correlation Chart
The statistical analysis conducted on geographies consisting of 117,535,348 people shows a mild negative correlation between the proportion of Potawatomi and percentage of population with at least professional degree education in the United States with a correlation coefficient (R) of -0.354 and weighted average of 3.6%. Similarly, the statistical analysis conducted on geographies consisting of 236,073,386 people shows a mild negative correlation between the proportion of Immigrants from Nicaragua and percentage of population with at least professional degree education in the United States with a correlation coefficient (R) of -0.306 and weighted average of 3.7%, a difference of 4.8%.
Professional Degree Correlation Summary
| Measurement | Potawatomi | Immigrants from Nicaragua |
| Minimum | 0.21% | 0.72% |
| Maximum | 4.4% | 7.2% |
| Range | 4.2% | 6.5% |
| Mean | 1.8% | 3.2% |
| Median | 1.5% | 3.2% |
| Interquartile 25% (IQ1) | 1.0% | 2.2% |
| Interquartile 75% (IQ3) | 2.4% | 4.1% |
| Interquartile Range (IQR) | 1.4% | 1.9% |
| Standard Deviation (Sample) | 1.1% | 1.4% |
| Standard Deviation (Population) | 1.1% | 1.4% |
Similar Demographics by Professional Degree
Demographics Similar to Potawatomi by Professional Degree
In terms of professional degree, the demographic groups most similar to Potawatomi are American (3.6%, a difference of 0.13%), Immigrants from Jamaica (3.6%, a difference of 0.19%), Belizean (3.6%, a difference of 0.22%), Immigrants from Dominica (3.6%, a difference of 0.23%), and Liberian (3.6%, a difference of 0.27%).
| Demographics | Rating | Rank | Professional Degree |
| Delaware | 0.7 /100 | #267 | Tragic 3.6% |
| Aleuts | 0.7 /100 | #268 | Tragic 3.6% |
| Immigrants | Cuba | 0.6 /100 | #269 | Tragic 3.6% |
| Central Americans | 0.6 /100 | #270 | Tragic 3.6% |
| Belizeans | 0.5 /100 | #271 | Tragic 3.6% |
| Immigrants | Jamaica | 0.5 /100 | #272 | Tragic 3.6% |
| Americans | 0.5 /100 | #273 | Tragic 3.6% |
| Potawatomi | 0.5 /100 | #274 | Tragic 3.6% |
| Immigrants | Dominica | 0.5 /100 | #275 | Tragic 3.6% |
| Liberians | 0.5 /100 | #276 | Tragic 3.6% |
| Cheyenne | 0.5 /100 | #277 | Tragic 3.6% |
| Japanese | 0.5 /100 | #278 | Tragic 3.5% |
| Immigrants | Portugal | 0.5 /100 | #279 | Tragic 3.5% |
| Dominicans | 0.5 /100 | #280 | Tragic 3.5% |
| Apache | 0.5 /100 | #281 | Tragic 3.5% |
Demographics Similar to Immigrants from Nicaragua by Professional Degree
In terms of professional degree, the demographic groups most similar to Immigrants from Nicaragua are Jamaican (3.7%, a difference of 0.14%), Pueblo (3.7%, a difference of 0.24%), Immigrants from Fiji (3.7%, a difference of 0.25%), Immigrants from Grenada (3.7%, a difference of 0.31%), and Tongan (3.7%, a difference of 0.39%).
| Demographics | Rating | Rank | Professional Degree |
| Immigrants | Bahamas | 2.0 /100 | #244 | Tragic 3.8% |
| French American Indians | 1.7 /100 | #245 | Tragic 3.8% |
| Marshallese | 1.7 /100 | #246 | Tragic 3.8% |
| Guyanese | 1.6 /100 | #247 | Tragic 3.8% |
| Hmong | 1.6 /100 | #248 | Tragic 3.7% |
| Immigrants | Grenada | 1.5 /100 | #249 | Tragic 3.7% |
| Immigrants | Fiji | 1.5 /100 | #250 | Tragic 3.7% |
| Immigrants | Nicaragua | 1.4 /100 | #251 | Tragic 3.7% |
| Jamaicans | 1.4 /100 | #252 | Tragic 3.7% |
| Pueblo | 1.4 /100 | #253 | Tragic 3.7% |
| Tongans | 1.3 /100 | #254 | Tragic 3.7% |
| Osage | 1.2 /100 | #255 | Tragic 3.7% |
| Iroquois | 1.2 /100 | #256 | Tragic 3.7% |
| Bahamians | 1.1 /100 | #257 | Tragic 3.7% |
| Immigrants | St. Vincent and the Grenadines | 1.1 /100 | #258 | Tragic 3.7% |