Ugandan vs Fijian Associate's Degree
COMPARE
Ugandan
Fijian
Associate's Degree
Associate's Degree Comparison
Ugandans
Fijians
48.7%
ASSOCIATE'S DEGREE
93.9/ 100
METRIC RATING
121st/ 347
METRIC RANK
37.4%
ASSOCIATE'S DEGREE
0.0/ 100
METRIC RATING
319th/ 347
METRIC RANK
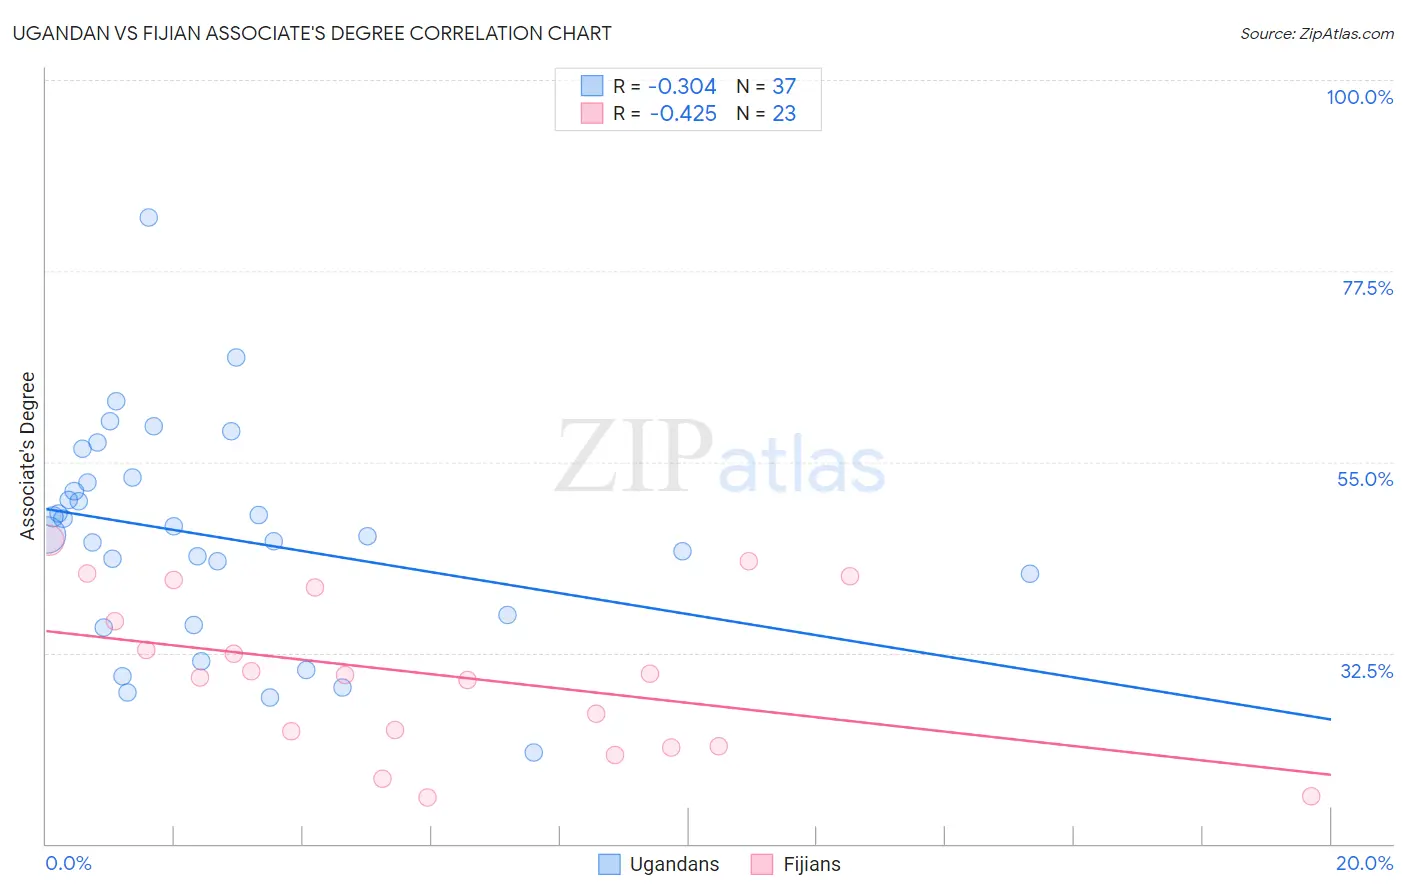
Ugandan vs Fijian Associate's Degree Correlation Chart
The statistical analysis conducted on geographies consisting of 94,018,576 people shows a mild negative correlation between the proportion of Ugandans and percentage of population with at least associate's degree education in the United States with a correlation coefficient (R) of -0.304 and weighted average of 48.7%. Similarly, the statistical analysis conducted on geographies consisting of 55,948,669 people shows a moderate negative correlation between the proportion of Fijians and percentage of population with at least associate's degree education in the United States with a correlation coefficient (R) of -0.425 and weighted average of 37.4%, a difference of 30.3%.
Associate's Degree Correlation Summary
| Measurement | Ugandan | Fijian |
| Minimum | 20.8% | 15.4% |
| Maximum | 83.8% | 45.8% |
| Range | 63.0% | 30.4% |
| Mean | 46.2% | 29.9% |
| Median | 46.4% | 29.9% |
| Interquartile 25% (IQ1) | 36.3% | 21.5% |
| Interquartile 75% (IQ3) | 52.8% | 40.1% |
| Interquartile Range (IQR) | 16.5% | 18.7% |
| Standard Deviation (Sample) | 12.7% | 9.3% |
| Standard Deviation (Population) | 12.5% | 9.1% |
Similar Demographics by Associate's Degree
Demographics Similar to Ugandans by Associate's Degree
In terms of associate's degree, the demographic groups most similar to Ugandans are Italian (48.7%, a difference of 0.0%), Brazilian (48.7%, a difference of 0.070%), Alsatian (48.8%, a difference of 0.23%), Lebanese (48.8%, a difference of 0.25%), and Albanian (48.8%, a difference of 0.26%).
| Demographics | Rating | Rank | Associate's Degree |
| Arabs | 95.3 /100 | #114 | Exceptional 49.0% |
| Luxembourgers | 95.1 /100 | #115 | Exceptional 48.9% |
| British | 95.0 /100 | #116 | Exceptional 48.9% |
| Afghans | 94.8 /100 | #117 | Exceptional 48.9% |
| Albanians | 94.7 /100 | #118 | Exceptional 48.8% |
| Lebanese | 94.6 /100 | #119 | Exceptional 48.8% |
| Alsatians | 94.6 /100 | #120 | Exceptional 48.8% |
| Ugandans | 93.9 /100 | #121 | Exceptional 48.7% |
| Italians | 93.9 /100 | #122 | Exceptional 48.7% |
| Brazilians | 93.7 /100 | #123 | Exceptional 48.7% |
| Serbians | 92.6 /100 | #124 | Exceptional 48.5% |
| Chinese | 92.5 /100 | #125 | Exceptional 48.5% |
| Immigrants | Syria | 92.2 /100 | #126 | Exceptional 48.5% |
| Immigrants | Uganda | 92.1 /100 | #127 | Exceptional 48.5% |
| Immigrants | Eastern Africa | 91.6 /100 | #128 | Exceptional 48.4% |
Demographics Similar to Fijians by Associate's Degree
In terms of associate's degree, the demographic groups most similar to Fijians are Cajun (37.4%, a difference of 0.030%), Immigrants from Yemen (37.3%, a difference of 0.15%), Alaska Native (37.5%, a difference of 0.22%), Pennsylvania German (37.2%, a difference of 0.43%), and Yaqui (37.6%, a difference of 0.45%).
| Demographics | Rating | Rank | Associate's Degree |
| Choctaw | 0.0 /100 | #312 | Tragic 37.8% |
| Hispanics or Latinos | 0.0 /100 | #313 | Tragic 37.7% |
| Seminole | 0.0 /100 | #314 | Tragic 37.7% |
| Creek | 0.0 /100 | #315 | Tragic 37.6% |
| Crow | 0.0 /100 | #316 | Tragic 37.6% |
| Yaqui | 0.0 /100 | #317 | Tragic 37.6% |
| Alaska Natives | 0.0 /100 | #318 | Tragic 37.5% |
| Fijians | 0.0 /100 | #319 | Tragic 37.4% |
| Cajuns | 0.0 /100 | #320 | Tragic 37.4% |
| Immigrants | Yemen | 0.0 /100 | #321 | Tragic 37.3% |
| Pennsylvania Germans | 0.0 /100 | #322 | Tragic 37.2% |
| Immigrants | Cabo Verde | 0.0 /100 | #323 | Tragic 36.8% |
| Arapaho | 0.0 /100 | #324 | Tragic 36.7% |
| Menominee | 0.0 /100 | #325 | Tragic 36.7% |
| Kiowa | 0.0 /100 | #326 | Tragic 36.5% |