Immigrants from Somalia vs Fijian Associate's Degree
COMPARE
Immigrants from Somalia
Fijian
Associate's Degree
Associate's Degree Comparison
Immigrants from Somalia
Fijians
46.5%
ASSOCIATE'S DEGREE
55.5/ 100
METRIC RATING
168th/ 347
METRIC RANK
37.4%
ASSOCIATE'S DEGREE
0.0/ 100
METRIC RATING
319th/ 347
METRIC RANK
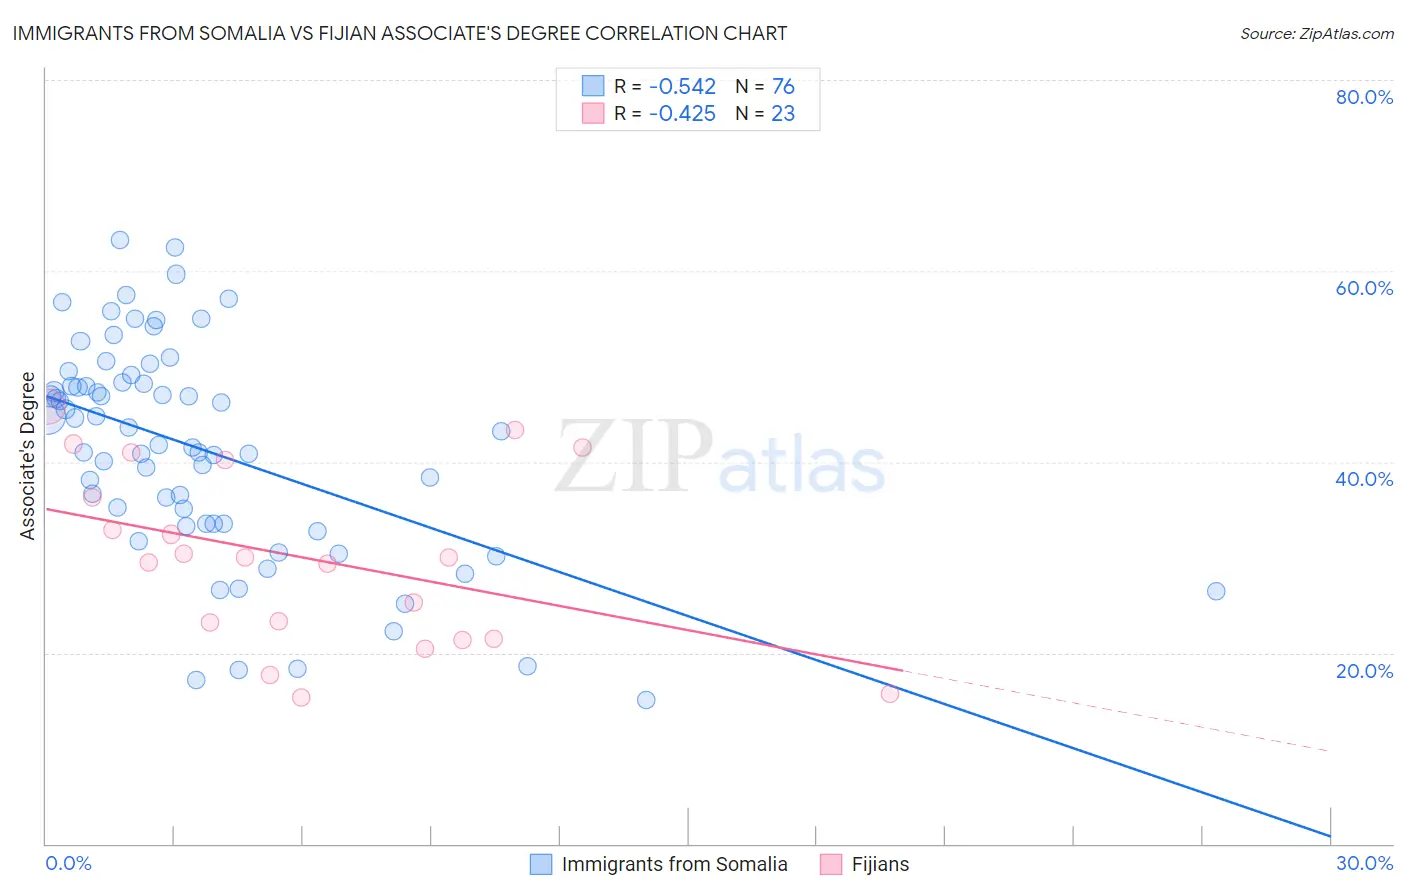
Immigrants from Somalia vs Fijian Associate's Degree Correlation Chart
The statistical analysis conducted on geographies consisting of 92,111,755 people shows a substantial negative correlation between the proportion of Immigrants from Somalia and percentage of population with at least associate's degree education in the United States with a correlation coefficient (R) of -0.542 and weighted average of 46.5%. Similarly, the statistical analysis conducted on geographies consisting of 55,948,669 people shows a moderate negative correlation between the proportion of Fijians and percentage of population with at least associate's degree education in the United States with a correlation coefficient (R) of -0.425 and weighted average of 37.4%, a difference of 24.5%.
Associate's Degree Correlation Summary
| Measurement | Immigrants from Somalia | Fijian |
| Minimum | 15.0% | 15.4% |
| Maximum | 63.3% | 45.8% |
| Range | 48.3% | 30.4% |
| Mean | 41.3% | 29.9% |
| Median | 42.5% | 29.9% |
| Interquartile 25% (IQ1) | 33.5% | 21.5% |
| Interquartile 75% (IQ3) | 48.3% | 40.1% |
| Interquartile Range (IQR) | 14.8% | 18.7% |
| Standard Deviation (Sample) | 11.3% | 9.3% |
| Standard Deviation (Population) | 11.2% | 9.1% |
Similar Demographics by Associate's Degree
Demographics Similar to Immigrants from Somalia by Associate's Degree
In terms of associate's degree, the demographic groups most similar to Immigrants from Somalia are Uruguayan (46.5%, a difference of 0.010%), Irish (46.5%, a difference of 0.14%), Basque (46.5%, a difference of 0.20%), Hungarian (46.7%, a difference of 0.29%), and Immigrants from Sierra Leone (46.7%, a difference of 0.29%).
| Demographics | Rating | Rank | Associate's Degree |
| Scandinavians | 65.2 /100 | #161 | Good 46.9% |
| Immigrants | Africa | 63.2 /100 | #162 | Good 46.8% |
| Somalis | 62.5 /100 | #163 | Good 46.8% |
| Colombians | 62.4 /100 | #164 | Good 46.8% |
| Immigrants | South America | 59.9 /100 | #165 | Average 46.7% |
| Hungarians | 59.3 /100 | #166 | Average 46.7% |
| Immigrants | Sierra Leone | 59.2 /100 | #167 | Average 46.7% |
| Immigrants | Somalia | 55.5 /100 | #168 | Average 46.5% |
| Uruguayans | 55.4 /100 | #169 | Average 46.5% |
| Irish | 53.6 /100 | #170 | Average 46.5% |
| Basques | 52.8 /100 | #171 | Average 46.5% |
| Peruvians | 50.5 /100 | #172 | Average 46.4% |
| Immigrants | Iraq | 50.3 /100 | #173 | Average 46.4% |
| English | 50.0 /100 | #174 | Average 46.4% |
| Belgians | 48.9 /100 | #175 | Average 46.3% |
Demographics Similar to Fijians by Associate's Degree
In terms of associate's degree, the demographic groups most similar to Fijians are Cajun (37.4%, a difference of 0.030%), Immigrants from Yemen (37.3%, a difference of 0.15%), Alaska Native (37.5%, a difference of 0.22%), Pennsylvania German (37.2%, a difference of 0.43%), and Yaqui (37.6%, a difference of 0.45%).
| Demographics | Rating | Rank | Associate's Degree |
| Choctaw | 0.0 /100 | #312 | Tragic 37.8% |
| Hispanics or Latinos | 0.0 /100 | #313 | Tragic 37.7% |
| Seminole | 0.0 /100 | #314 | Tragic 37.7% |
| Creek | 0.0 /100 | #315 | Tragic 37.6% |
| Crow | 0.0 /100 | #316 | Tragic 37.6% |
| Yaqui | 0.0 /100 | #317 | Tragic 37.6% |
| Alaska Natives | 0.0 /100 | #318 | Tragic 37.5% |
| Fijians | 0.0 /100 | #319 | Tragic 37.4% |
| Cajuns | 0.0 /100 | #320 | Tragic 37.4% |
| Immigrants | Yemen | 0.0 /100 | #321 | Tragic 37.3% |
| Pennsylvania Germans | 0.0 /100 | #322 | Tragic 37.2% |
| Immigrants | Cabo Verde | 0.0 /100 | #323 | Tragic 36.8% |
| Arapaho | 0.0 /100 | #324 | Tragic 36.7% |
| Menominee | 0.0 /100 | #325 | Tragic 36.7% |
| Kiowa | 0.0 /100 | #326 | Tragic 36.5% |