Cypriot vs Fijian Associate's Degree
COMPARE
Cypriot
Fijian
Associate's Degree
Associate's Degree Comparison
Cypriots
Fijians
56.4%
ASSOCIATE'S DEGREE
100.0/ 100
METRIC RATING
10th/ 347
METRIC RANK
37.4%
ASSOCIATE'S DEGREE
0.0/ 100
METRIC RATING
319th/ 347
METRIC RANK
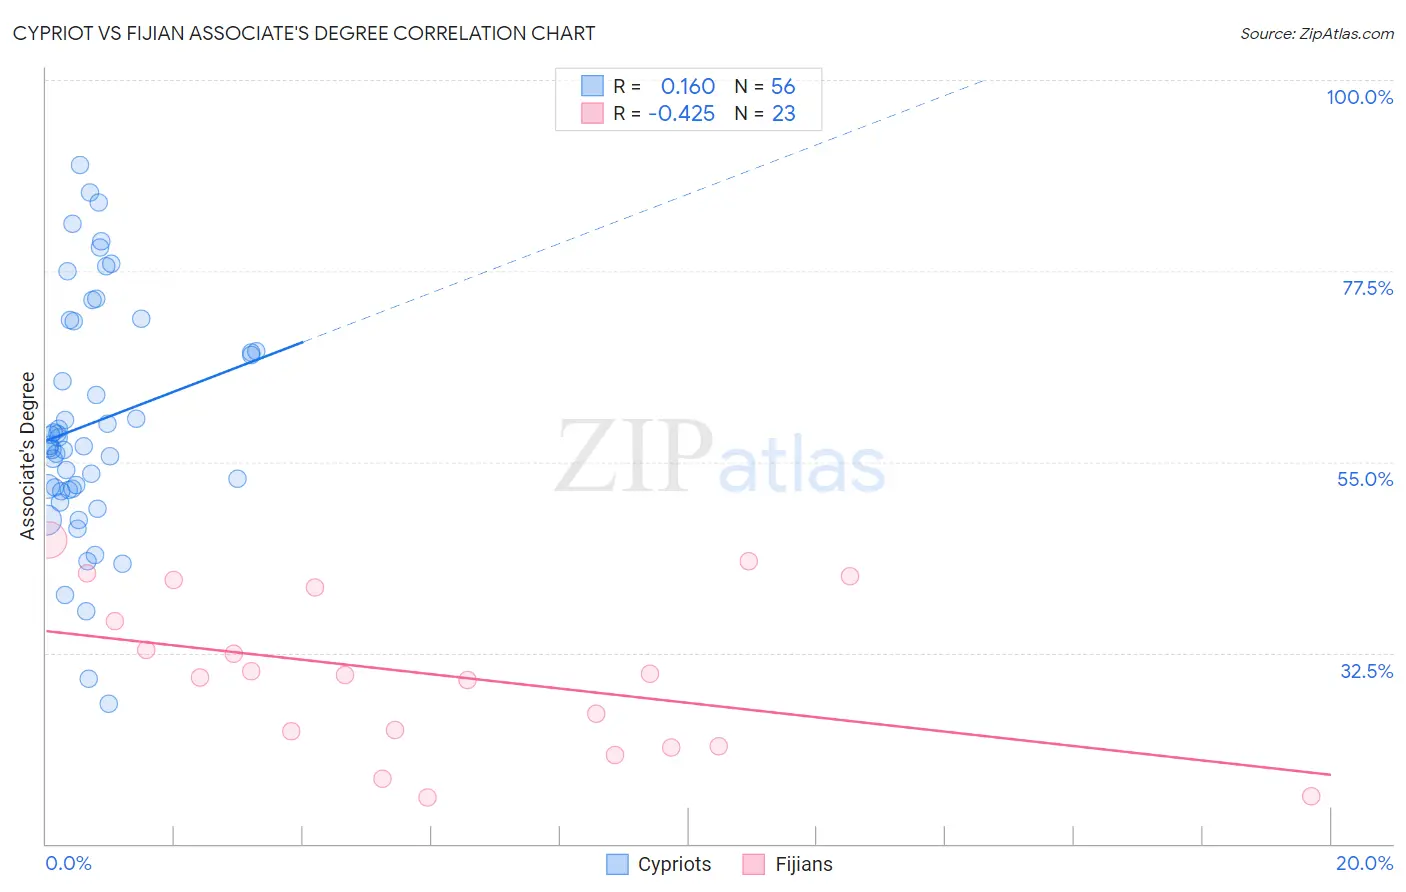
Cypriot vs Fijian Associate's Degree Correlation Chart
The statistical analysis conducted on geographies consisting of 61,863,675 people shows a poor positive correlation between the proportion of Cypriots and percentage of population with at least associate's degree education in the United States with a correlation coefficient (R) of 0.160 and weighted average of 56.4%. Similarly, the statistical analysis conducted on geographies consisting of 55,948,669 people shows a moderate negative correlation between the proportion of Fijians and percentage of population with at least associate's degree education in the United States with a correlation coefficient (R) of -0.425 and weighted average of 37.4%, a difference of 50.8%.
Associate's Degree Correlation Summary
| Measurement | Cypriot | Fijian |
| Minimum | 26.5% | 15.4% |
| Maximum | 90.0% | 45.8% |
| Range | 63.5% | 30.4% |
| Mean | 59.5% | 29.9% |
| Median | 56.9% | 29.9% |
| Interquartile 25% (IQ1) | 51.8% | 21.5% |
| Interquartile 75% (IQ3) | 69.7% | 40.1% |
| Interquartile Range (IQR) | 17.9% | 18.7% |
| Standard Deviation (Sample) | 14.0% | 9.3% |
| Standard Deviation (Population) | 13.9% | 9.1% |
Similar Demographics by Associate's Degree
Demographics Similar to Cypriots by Associate's Degree
In terms of associate's degree, the demographic groups most similar to Cypriots are Immigrants from Israel (56.8%, a difference of 0.72%), Immigrants from Australia (55.8%, a difference of 1.0%), Immigrants from South Central Asia (55.7%, a difference of 1.1%), Immigrants from China (55.5%, a difference of 1.7%), and Immigrants from Hong Kong (55.4%, a difference of 1.8%).
| Demographics | Rating | Rank | Associate's Degree |
| Immigrants | India | 100.0 /100 | #3 | Exceptional 58.5% |
| Immigrants | Taiwan | 100.0 /100 | #4 | Exceptional 58.4% |
| Iranians | 100.0 /100 | #5 | Exceptional 58.2% |
| Okinawans | 100.0 /100 | #6 | Exceptional 57.7% |
| Immigrants | Iran | 100.0 /100 | #7 | Exceptional 57.7% |
| Thais | 100.0 /100 | #8 | Exceptional 57.4% |
| Immigrants | Israel | 100.0 /100 | #9 | Exceptional 56.8% |
| Cypriots | 100.0 /100 | #10 | Exceptional 56.4% |
| Immigrants | Australia | 100.0 /100 | #11 | Exceptional 55.8% |
| Immigrants | South Central Asia | 100.0 /100 | #12 | Exceptional 55.7% |
| Immigrants | China | 100.0 /100 | #13 | Exceptional 55.5% |
| Immigrants | Hong Kong | 100.0 /100 | #14 | Exceptional 55.4% |
| Immigrants | Eastern Asia | 100.0 /100 | #15 | Exceptional 55.4% |
| Soviet Union | 100.0 /100 | #16 | Exceptional 55.1% |
| Eastern Europeans | 100.0 /100 | #17 | Exceptional 55.0% |
Demographics Similar to Fijians by Associate's Degree
In terms of associate's degree, the demographic groups most similar to Fijians are Cajun (37.4%, a difference of 0.030%), Immigrants from Yemen (37.3%, a difference of 0.15%), Alaska Native (37.5%, a difference of 0.22%), Pennsylvania German (37.2%, a difference of 0.43%), and Yaqui (37.6%, a difference of 0.45%).
| Demographics | Rating | Rank | Associate's Degree |
| Choctaw | 0.0 /100 | #312 | Tragic 37.8% |
| Hispanics or Latinos | 0.0 /100 | #313 | Tragic 37.7% |
| Seminole | 0.0 /100 | #314 | Tragic 37.7% |
| Creek | 0.0 /100 | #315 | Tragic 37.6% |
| Crow | 0.0 /100 | #316 | Tragic 37.6% |
| Yaqui | 0.0 /100 | #317 | Tragic 37.6% |
| Alaska Natives | 0.0 /100 | #318 | Tragic 37.5% |
| Fijians | 0.0 /100 | #319 | Tragic 37.4% |
| Cajuns | 0.0 /100 | #320 | Tragic 37.4% |
| Immigrants | Yemen | 0.0 /100 | #321 | Tragic 37.3% |
| Pennsylvania Germans | 0.0 /100 | #322 | Tragic 37.2% |
| Immigrants | Cabo Verde | 0.0 /100 | #323 | Tragic 36.8% |
| Arapaho | 0.0 /100 | #324 | Tragic 36.7% |
| Menominee | 0.0 /100 | #325 | Tragic 36.7% |
| Kiowa | 0.0 /100 | #326 | Tragic 36.5% |