Native Hawaiian vs Immigrants from Ghana Master's Degree
COMPARE
Native Hawaiian
Immigrants from Ghana
Master's Degree
Master's Degree Comparison
Native Hawaiians
Immigrants from Ghana
12.3%
MASTER'S DEGREE
0.4/ 100
METRIC RATING
268th/ 347
METRIC RANK
15.0%
MASTER'S DEGREE
53.6/ 100
METRIC RATING
171st/ 347
METRIC RANK
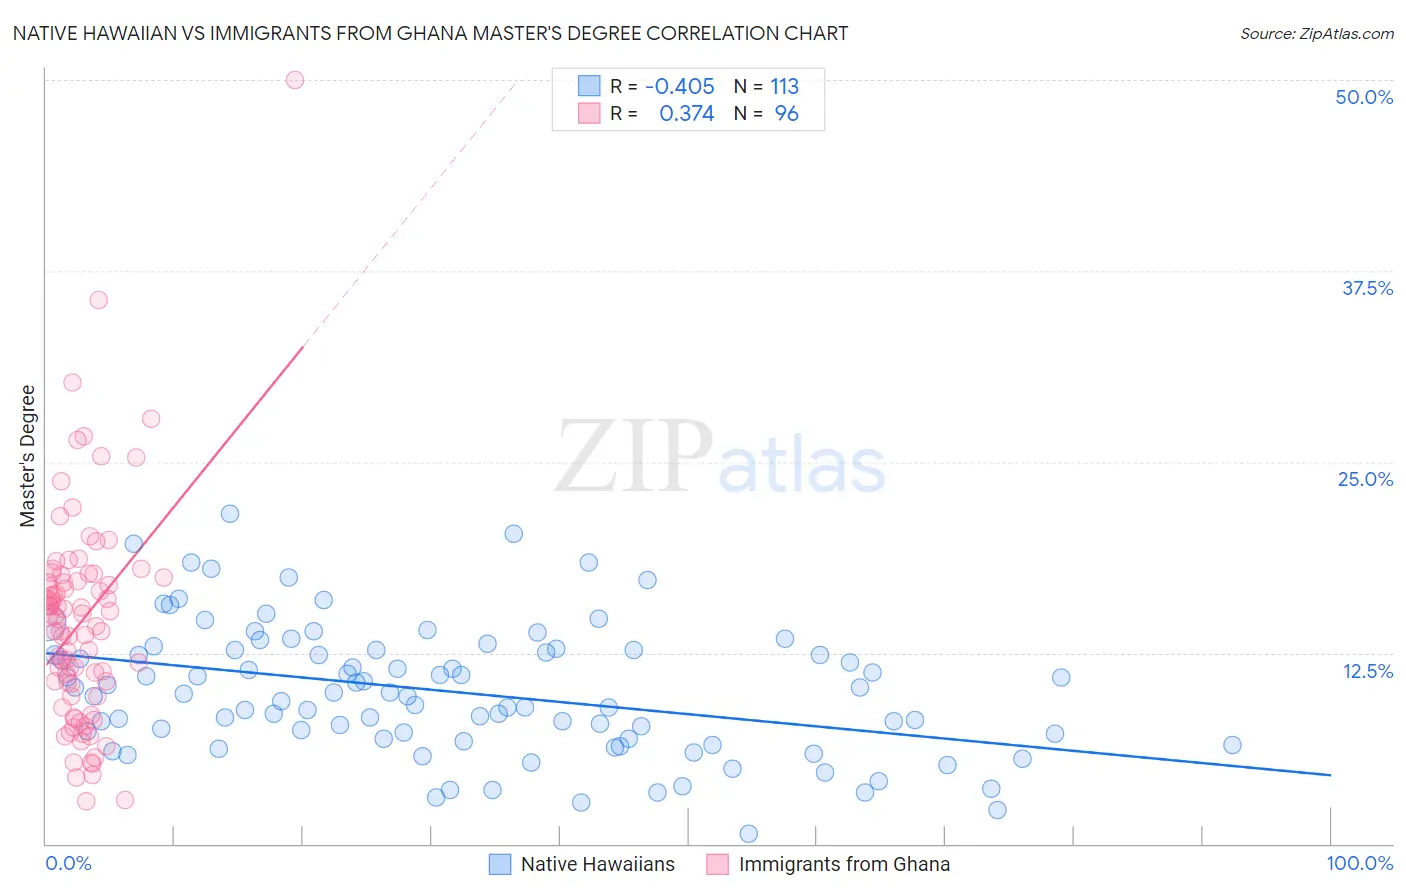
Native Hawaiian vs Immigrants from Ghana Master's Degree Correlation Chart
The statistical analysis conducted on geographies consisting of 331,993,675 people shows a moderate negative correlation between the proportion of Native Hawaiians and percentage of population with at least master's degree education in the United States with a correlation coefficient (R) of -0.405 and weighted average of 12.3%. Similarly, the statistical analysis conducted on geographies consisting of 199,892,206 people shows a mild positive correlation between the proportion of Immigrants from Ghana and percentage of population with at least master's degree education in the United States with a correlation coefficient (R) of 0.374 and weighted average of 15.0%, a difference of 22.2%.
Master's Degree Correlation Summary
| Measurement | Native Hawaiian | Immigrants from Ghana |
| Minimum | 0.67% | 2.8% |
| Maximum | 21.6% | 50.0% |
| Range | 20.9% | 47.2% |
| Mean | 10.0% | 14.5% |
| Median | 9.8% | 14.8% |
| Interquartile 25% (IQ1) | 6.9% | 10.1% |
| Interquartile 75% (IQ3) | 12.7% | 17.3% |
| Interquartile Range (IQR) | 5.8% | 7.2% |
| Standard Deviation (Sample) | 4.2% | 7.1% |
| Standard Deviation (Population) | 4.2% | 7.1% |
Similar Demographics by Master's Degree
Demographics Similar to Native Hawaiians by Master's Degree
In terms of master's degree, the demographic groups most similar to Native Hawaiians are American (12.3%, a difference of 0.25%), Central American (12.2%, a difference of 0.65%), Salvadoran (12.2%, a difference of 0.78%), Bahamian (12.4%, a difference of 1.0%), and Immigrants from Fiji (12.4%, a difference of 1.2%).
| Demographics | Rating | Rank | Master's Degree |
| Tongans | 0.6 /100 | #261 | Tragic 12.5% |
| Nicaraguans | 0.6 /100 | #262 | Tragic 12.5% |
| Central American Indians | 0.5 /100 | #263 | Tragic 12.4% |
| Belizeans | 0.5 /100 | #264 | Tragic 12.4% |
| Immigrants | Fiji | 0.5 /100 | #265 | Tragic 12.4% |
| Bahamians | 0.5 /100 | #266 | Tragic 12.4% |
| Americans | 0.4 /100 | #267 | Tragic 12.3% |
| Native Hawaiians | 0.4 /100 | #268 | Tragic 12.3% |
| Central Americans | 0.3 /100 | #269 | Tragic 12.2% |
| Salvadorans | 0.3 /100 | #270 | Tragic 12.2% |
| Haitians | 0.3 /100 | #271 | Tragic 12.1% |
| Comanche | 0.3 /100 | #272 | Tragic 12.1% |
| Blackfeet | 0.3 /100 | #273 | Tragic 12.1% |
| Cape Verdeans | 0.3 /100 | #274 | Tragic 12.1% |
| Cubans | 0.3 /100 | #275 | Tragic 12.1% |
Demographics Similar to Immigrants from Ghana by Master's Degree
In terms of master's degree, the demographic groups most similar to Immigrants from Ghana are Immigrants from Uruguay (15.0%, a difference of 0.10%), Costa Rican (15.0%, a difference of 0.14%), Irish (15.0%, a difference of 0.35%), Slovak (14.9%, a difference of 0.46%), and Immigrants from Peru (14.9%, a difference of 0.51%).
| Demographics | Rating | Rank | Master's Degree |
| Colombians | 66.9 /100 | #164 | Good 15.3% |
| Immigrants | Kenya | 66.6 /100 | #165 | Good 15.3% |
| Swedes | 66.1 /100 | #166 | Good 15.2% |
| Senegalese | 65.6 /100 | #167 | Good 15.2% |
| Immigrants | North Macedonia | 64.5 /100 | #168 | Good 15.2% |
| Scottish | 62.7 /100 | #169 | Good 15.2% |
| Irish | 56.3 /100 | #170 | Average 15.0% |
| Immigrants | Ghana | 53.6 /100 | #171 | Average 15.0% |
| Immigrants | Uruguay | 52.8 /100 | #172 | Average 15.0% |
| Costa Ricans | 52.5 /100 | #173 | Average 15.0% |
| Slovaks | 50.0 /100 | #174 | Average 14.9% |
| Immigrants | Peru | 49.6 /100 | #175 | Average 14.9% |
| Nigerians | 48.6 /100 | #176 | Average 14.9% |
| Immigrants | Colombia | 48.3 /100 | #177 | Average 14.9% |
| English | 45.0 /100 | #178 | Average 14.8% |