Kiowa vs Immigrants from Vietnam No Schooling Completed
COMPARE
Kiowa
Immigrants from Vietnam
No Schooling Completed
No Schooling Completed Comparison
Kiowa
Immigrants from Vietnam
1.6%
NO SCHOOLING COMPLETED
99.8/ 100
METRIC RATING
58th/ 347
METRIC RANK
3.3%
NO SCHOOLING COMPLETED
0.0/ 100
METRIC RATING
329th/ 347
METRIC RANK
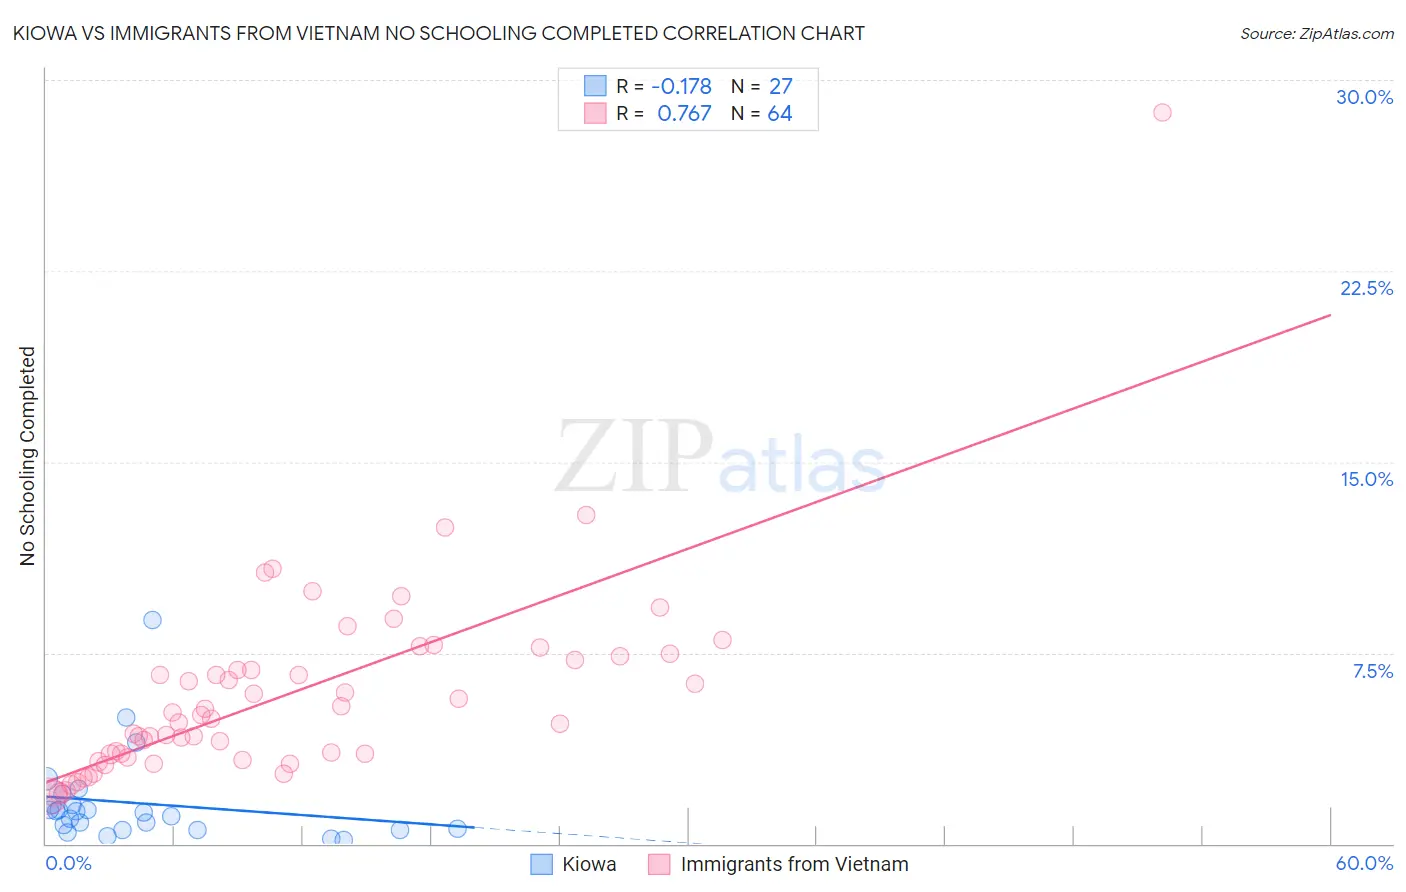
Kiowa vs Immigrants from Vietnam No Schooling Completed Correlation Chart
The statistical analysis conducted on geographies consisting of 55,891,433 people shows a poor negative correlation between the proportion of Kiowa and percentage of population with no schooling in the United States with a correlation coefficient (R) of -0.178 and weighted average of 1.6%. Similarly, the statistical analysis conducted on geographies consisting of 401,890,779 people shows a strong positive correlation between the proportion of Immigrants from Vietnam and percentage of population with no schooling in the United States with a correlation coefficient (R) of 0.767 and weighted average of 3.3%, a difference of 102.0%.
No Schooling Completed Correlation Summary
| Measurement | Kiowa | Immigrants from Vietnam |
| Minimum | 0.13% | 1.9% |
| Maximum | 8.8% | 28.7% |
| Range | 8.6% | 26.8% |
| Mean | 1.6% | 5.9% |
| Median | 1.2% | 5.0% |
| Interquartile 25% (IQ1) | 0.55% | 3.5% |
| Interquartile 75% (IQ3) | 1.5% | 7.3% |
| Interquartile Range (IQR) | 0.99% | 3.8% |
| Standard Deviation (Sample) | 1.8% | 3.9% |
| Standard Deviation (Population) | 1.8% | 3.9% |
Similar Demographics by No Schooling Completed
Demographics Similar to Kiowa by No Schooling Completed
In terms of no schooling completed, the demographic groups most similar to Kiowa are Slavic (1.7%, a difference of 0.070%), Austrian (1.6%, a difference of 0.16%), American (1.7%, a difference of 0.19%), Immigrants from North America (1.6%, a difference of 0.46%), and Greek (1.6%, a difference of 0.47%).
| Demographics | Rating | Rank | No Schooling Completed |
| Chippewa | 99.8 /100 | #51 | Exceptional 1.6% |
| Immigrants | Canada | 99.8 /100 | #52 | Exceptional 1.6% |
| Creek | 99.8 /100 | #53 | Exceptional 1.6% |
| Crow | 99.8 /100 | #54 | Exceptional 1.6% |
| Greeks | 99.8 /100 | #55 | Exceptional 1.6% |
| Immigrants | North America | 99.8 /100 | #56 | Exceptional 1.6% |
| Austrians | 99.8 /100 | #57 | Exceptional 1.6% |
| Kiowa | 99.8 /100 | #58 | Exceptional 1.6% |
| Slavs | 99.8 /100 | #59 | Exceptional 1.7% |
| Americans | 99.8 /100 | #60 | Exceptional 1.7% |
| Tsimshian | 99.8 /100 | #61 | Exceptional 1.7% |
| Immigrants | Northern Europe | 99.8 /100 | #62 | Exceptional 1.7% |
| Russians | 99.8 /100 | #63 | Exceptional 1.7% |
| New Zealanders | 99.7 /100 | #64 | Exceptional 1.7% |
| Serbians | 99.7 /100 | #65 | Exceptional 1.7% |
Demographics Similar to Immigrants from Vietnam by No Schooling Completed
In terms of no schooling completed, the demographic groups most similar to Immigrants from Vietnam are Immigrants from Armenia (3.3%, a difference of 0.42%), Japanese (3.3%, a difference of 0.45%), Mexican (3.3%, a difference of 1.1%), Immigrants from Latin America (3.3%, a difference of 1.3%), and Central American (3.4%, a difference of 2.0%).
| Demographics | Rating | Rank | No Schooling Completed |
| Immigrants | Honduras | 0.0 /100 | #322 | Tragic 3.2% |
| Vietnamese | 0.0 /100 | #323 | Tragic 3.2% |
| Mexican American Indians | 0.0 /100 | #324 | Tragic 3.2% |
| Dominicans | 0.0 /100 | #325 | Tragic 3.2% |
| Indonesians | 0.0 /100 | #326 | Tragic 3.2% |
| Immigrants | Latin America | 0.0 /100 | #327 | Tragic 3.3% |
| Mexicans | 0.0 /100 | #328 | Tragic 3.3% |
| Immigrants | Vietnam | 0.0 /100 | #329 | Tragic 3.3% |
| Immigrants | Armenia | 0.0 /100 | #330 | Tragic 3.3% |
| Japanese | 0.0 /100 | #331 | Tragic 3.3% |
| Central Americans | 0.0 /100 | #332 | Tragic 3.4% |
| Immigrants | Dominican Republic | 0.0 /100 | #333 | Tragic 3.4% |
| Guatemalans | 0.0 /100 | #334 | Tragic 3.5% |
| Immigrants | Cambodia | 0.0 /100 | #335 | Tragic 3.5% |
| Immigrants | Fiji | 0.0 /100 | #336 | Tragic 3.5% |