Peruvian vs Ugandan 11th Grade
COMPARE
Peruvian
Ugandan
11th Grade
11th Grade Comparison
Peruvians
Ugandans
91.5%
11TH GRADE
1.0/ 100
METRIC RATING
249th/ 347
METRIC RANK
92.9%
11TH GRADE
81.4/ 100
METRIC RATING
143rd/ 347
METRIC RANK
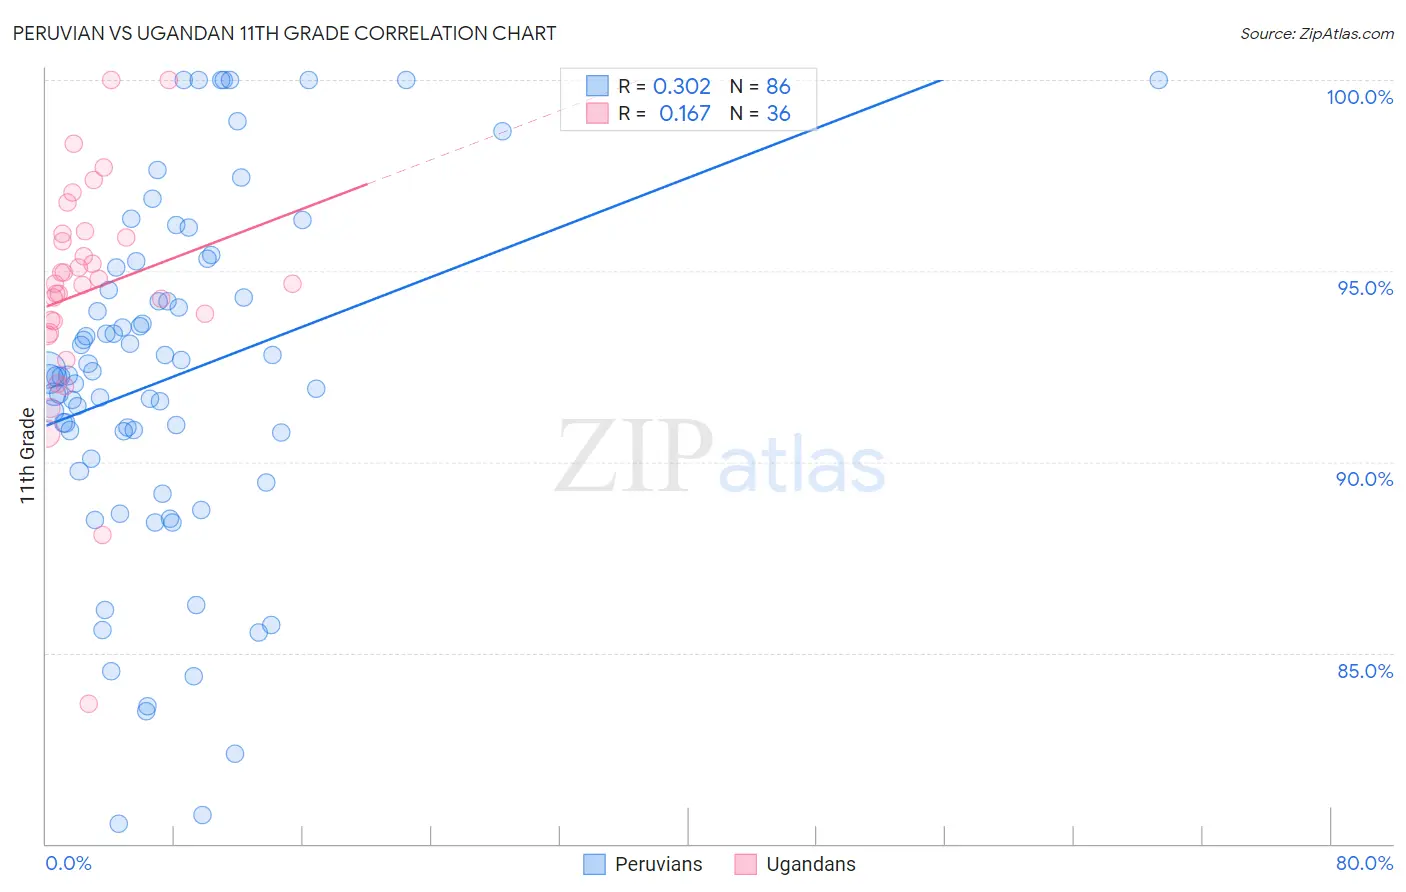
Peruvian vs Ugandan 11th Grade Correlation Chart
The statistical analysis conducted on geographies consisting of 363,251,075 people shows a mild positive correlation between the proportion of Peruvians and percentage of population with at least 11th grade education in the United States with a correlation coefficient (R) of 0.302 and weighted average of 91.5%. Similarly, the statistical analysis conducted on geographies consisting of 93,991,892 people shows a poor positive correlation between the proportion of Ugandans and percentage of population with at least 11th grade education in the United States with a correlation coefficient (R) of 0.167 and weighted average of 92.9%, a difference of 1.5%.
11th Grade Correlation Summary
| Measurement | Peruvian | Ugandan |
| Minimum | 80.5% | 83.7% |
| Maximum | 100.0% | 100.0% |
| Range | 19.5% | 16.3% |
| Mean | 92.2% | 94.5% |
| Median | 92.2% | 94.7% |
| Interquartile 25% (IQ1) | 90.1% | 93.5% |
| Interquartile 75% (IQ3) | 94.5% | 95.9% |
| Interquartile Range (IQR) | 4.4% | 2.4% |
| Standard Deviation (Sample) | 4.5% | 3.0% |
| Standard Deviation (Population) | 4.5% | 3.0% |
Similar Demographics by 11th Grade
Demographics Similar to Peruvians by 11th Grade
In terms of 11th grade, the demographic groups most similar to Peruvians are Immigrants from Uzbekistan (91.5%, a difference of 0.0%), Ghanaian (91.5%, a difference of 0.0%), Immigrants from Philippines (91.5%, a difference of 0.010%), Immigrants from Costa Rica (91.4%, a difference of 0.020%), and Immigrants from Nigeria (91.4%, a difference of 0.040%).
| Demographics | Rating | Rank | 11th Grade |
| Immigrants | Middle Africa | 1.6 /100 | #242 | Tragic 91.6% |
| Immigrants | Thailand | 1.4 /100 | #243 | Tragic 91.6% |
| Senegalese | 1.4 /100 | #244 | Tragic 91.6% |
| Africans | 1.3 /100 | #245 | Tragic 91.5% |
| Seminole | 1.2 /100 | #246 | Tragic 91.5% |
| Immigrants | Philippines | 1.0 /100 | #247 | Tragic 91.5% |
| Immigrants | Uzbekistan | 1.0 /100 | #248 | Tragic 91.5% |
| Peruvians | 1.0 /100 | #249 | Tragic 91.5% |
| Ghanaians | 0.9 /100 | #250 | Tragic 91.5% |
| Immigrants | Costa Rica | 0.9 /100 | #251 | Tragic 91.4% |
| Immigrants | Nigeria | 0.8 /100 | #252 | Tragic 91.4% |
| Immigrants | South America | 0.8 /100 | #253 | Tragic 91.4% |
| Immigrants | Eritrea | 0.7 /100 | #254 | Tragic 91.4% |
| Blacks/African Americans | 0.7 /100 | #255 | Tragic 91.4% |
| Immigrants | Senegal | 0.7 /100 | #256 | Tragic 91.4% |
Demographics Similar to Ugandans by 11th Grade
In terms of 11th grade, the demographic groups most similar to Ugandans are Kenyan (92.9%, a difference of 0.010%), Assyrian/Chaldean/Syriac (92.8%, a difference of 0.020%), Venezuelan (92.9%, a difference of 0.030%), Chilean (92.9%, a difference of 0.030%), and Pakistani (92.8%, a difference of 0.030%).
| Demographics | Rating | Rank | 11th Grade |
| Cree | 85.9 /100 | #136 | Excellent 92.9% |
| Arabs | 85.4 /100 | #137 | Excellent 92.9% |
| Immigrants | Brazil | 85.1 /100 | #138 | Excellent 92.9% |
| Crow | 84.1 /100 | #139 | Excellent 92.9% |
| Venezuelans | 83.4 /100 | #140 | Excellent 92.9% |
| Chileans | 83.0 /100 | #141 | Excellent 92.9% |
| Kenyans | 82.0 /100 | #142 | Excellent 92.9% |
| Ugandans | 81.4 /100 | #143 | Excellent 92.9% |
| Assyrians/Chaldeans/Syriacs | 80.5 /100 | #144 | Excellent 92.8% |
| Pakistanis | 79.6 /100 | #145 | Good 92.8% |
| Iroquois | 79.1 /100 | #146 | Good 92.8% |
| Immigrants | Kenya | 78.7 /100 | #147 | Good 92.8% |
| Hmong | 78.6 /100 | #148 | Good 92.8% |
| Immigrants | Poland | 78.5 /100 | #149 | Good 92.8% |
| Immigrants | Egypt | 77.5 /100 | #150 | Good 92.8% |