Sri Lankan vs Ugandan 11th Grade
COMPARE
Sri Lankan
Ugandan
11th Grade
11th Grade Comparison
Sri Lankans
Ugandans
90.7%
11TH GRADE
0.0/ 100
METRIC RATING
280th/ 347
METRIC RANK
92.9%
11TH GRADE
81.4/ 100
METRIC RATING
143rd/ 347
METRIC RANK
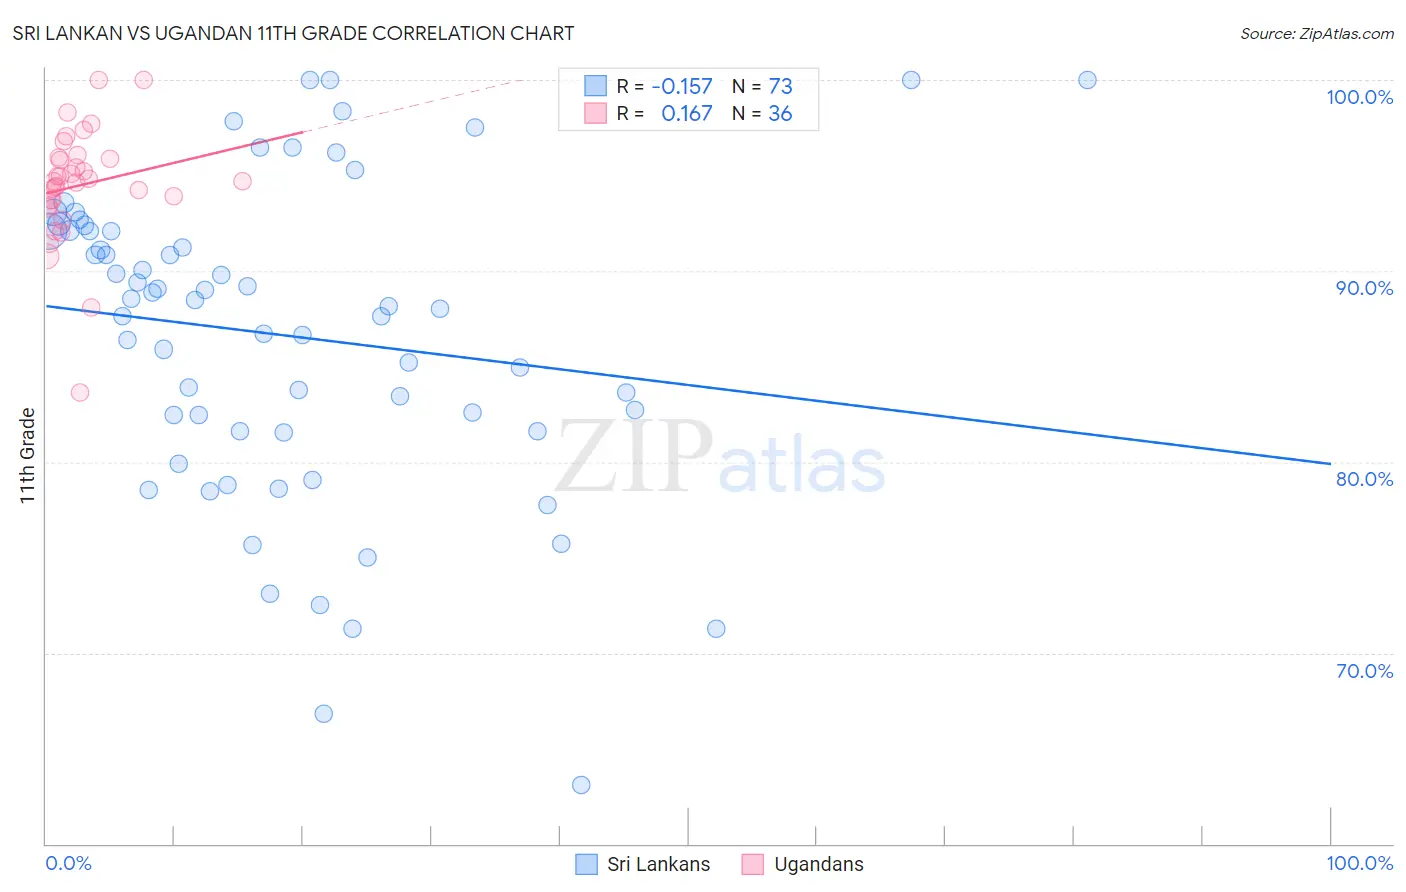
Sri Lankan vs Ugandan 11th Grade Correlation Chart
The statistical analysis conducted on geographies consisting of 440,593,537 people shows a poor negative correlation between the proportion of Sri Lankans and percentage of population with at least 11th grade education in the United States with a correlation coefficient (R) of -0.157 and weighted average of 90.7%. Similarly, the statistical analysis conducted on geographies consisting of 93,991,892 people shows a poor positive correlation between the proportion of Ugandans and percentage of population with at least 11th grade education in the United States with a correlation coefficient (R) of 0.167 and weighted average of 92.9%, a difference of 2.4%.
11th Grade Correlation Summary
| Measurement | Sri Lankan | Ugandan |
| Minimum | 63.1% | 83.7% |
| Maximum | 100.0% | 100.0% |
| Range | 36.9% | 16.3% |
| Mean | 86.6% | 94.5% |
| Median | 88.1% | 94.7% |
| Interquartile 25% (IQ1) | 81.6% | 93.5% |
| Interquartile 75% (IQ3) | 92.1% | 95.9% |
| Interquartile Range (IQR) | 10.5% | 2.4% |
| Standard Deviation (Sample) | 8.2% | 3.0% |
| Standard Deviation (Population) | 8.1% | 3.0% |
Similar Demographics by 11th Grade
Demographics Similar to Sri Lankans by 11th Grade
In terms of 11th grade, the demographic groups most similar to Sri Lankans are Dutch West Indian (90.7%, a difference of 0.050%), Barbadian (90.8%, a difference of 0.060%), Immigrants from St. Vincent and the Grenadines (90.7%, a difference of 0.060%), Immigrants from Barbados (90.7%, a difference of 0.070%), and Malaysian (90.8%, a difference of 0.11%).
| Demographics | Rating | Rank | 11th Grade |
| Paiute | 0.1 /100 | #273 | Tragic 91.0% |
| Immigrants | Trinidad and Tobago | 0.1 /100 | #274 | Tragic 90.9% |
| Immigrants | South Eastern Asia | 0.1 /100 | #275 | Tragic 90.9% |
| Bangladeshis | 0.1 /100 | #276 | Tragic 90.9% |
| Immigrants | Congo | 0.1 /100 | #277 | Tragic 90.9% |
| Malaysians | 0.1 /100 | #278 | Tragic 90.8% |
| Barbadians | 0.0 /100 | #279 | Tragic 90.8% |
| Sri Lankans | 0.0 /100 | #280 | Tragic 90.7% |
| Dutch West Indians | 0.0 /100 | #281 | Tragic 90.7% |
| Immigrants | St. Vincent and the Grenadines | 0.0 /100 | #282 | Tragic 90.7% |
| Immigrants | Barbados | 0.0 /100 | #283 | Tragic 90.7% |
| Immigrants | Laos | 0.0 /100 | #284 | Tragic 90.5% |
| Immigrants | Burma/Myanmar | 0.0 /100 | #285 | Tragic 90.4% |
| Immigrants | West Indies | 0.0 /100 | #286 | Tragic 90.4% |
| Apache | 0.0 /100 | #287 | Tragic 90.4% |
Demographics Similar to Ugandans by 11th Grade
In terms of 11th grade, the demographic groups most similar to Ugandans are Kenyan (92.9%, a difference of 0.010%), Assyrian/Chaldean/Syriac (92.8%, a difference of 0.020%), Venezuelan (92.9%, a difference of 0.030%), Chilean (92.9%, a difference of 0.030%), and Pakistani (92.8%, a difference of 0.030%).
| Demographics | Rating | Rank | 11th Grade |
| Cree | 85.9 /100 | #136 | Excellent 92.9% |
| Arabs | 85.4 /100 | #137 | Excellent 92.9% |
| Immigrants | Brazil | 85.1 /100 | #138 | Excellent 92.9% |
| Crow | 84.1 /100 | #139 | Excellent 92.9% |
| Venezuelans | 83.4 /100 | #140 | Excellent 92.9% |
| Chileans | 83.0 /100 | #141 | Excellent 92.9% |
| Kenyans | 82.0 /100 | #142 | Excellent 92.9% |
| Ugandans | 81.4 /100 | #143 | Excellent 92.9% |
| Assyrians/Chaldeans/Syriacs | 80.5 /100 | #144 | Excellent 92.8% |
| Pakistanis | 79.6 /100 | #145 | Good 92.8% |
| Iroquois | 79.1 /100 | #146 | Good 92.8% |
| Immigrants | Kenya | 78.7 /100 | #147 | Good 92.8% |
| Hmong | 78.6 /100 | #148 | Good 92.8% |
| Immigrants | Poland | 78.5 /100 | #149 | Good 92.8% |
| Immigrants | Egypt | 77.5 /100 | #150 | Good 92.8% |