Peruvian vs Salvadoran 11th Grade
COMPARE
Peruvian
Salvadoran
11th Grade
11th Grade Comparison
Peruvians
Salvadorans
91.5%
11TH GRADE
1.0/ 100
METRIC RATING
249th/ 347
METRIC RANK
86.2%
11TH GRADE
0.0/ 100
METRIC RATING
340th/ 347
METRIC RANK
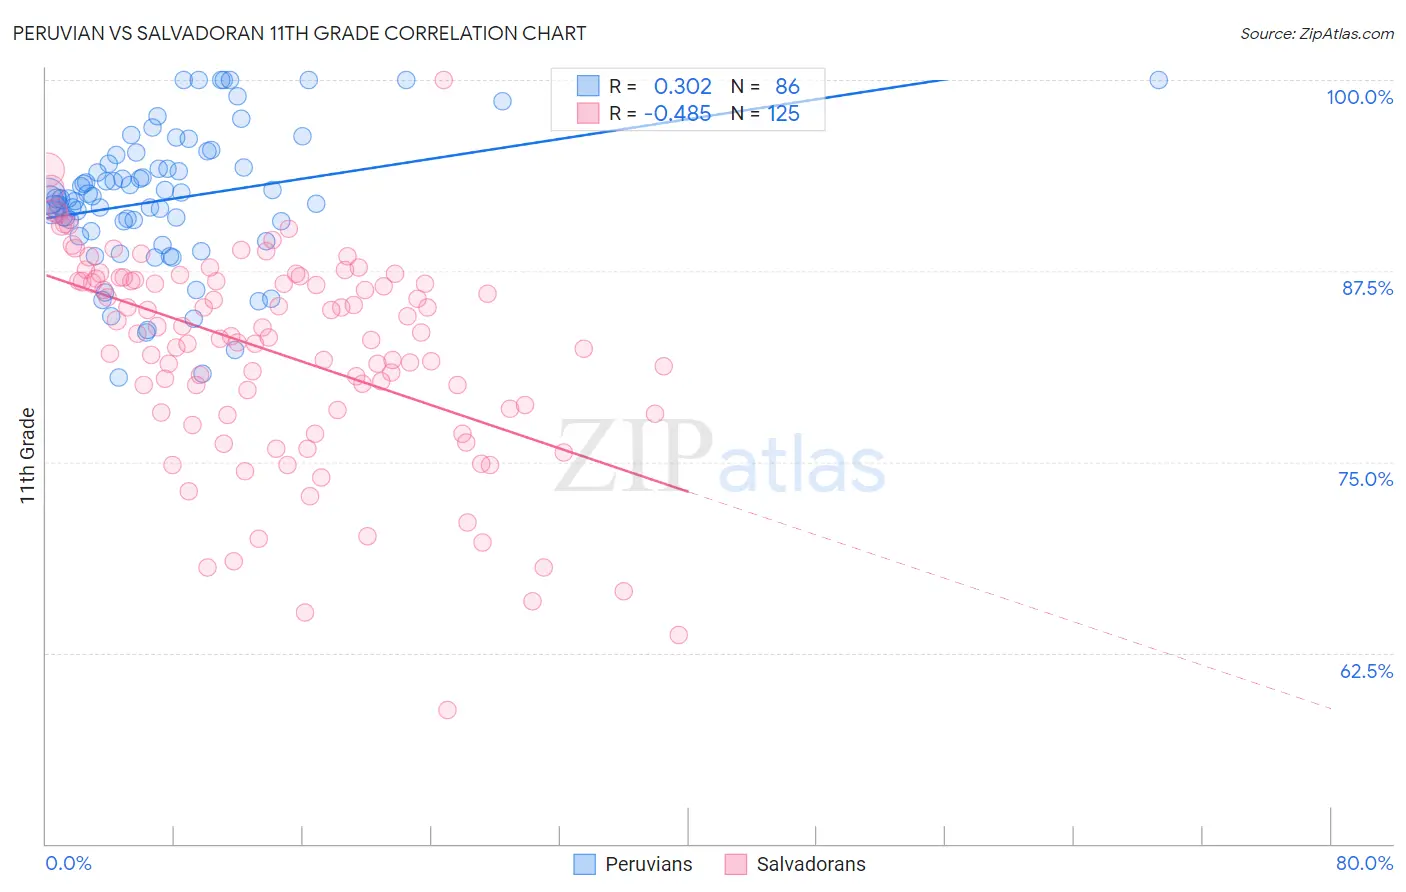
Peruvian vs Salvadoran 11th Grade Correlation Chart
The statistical analysis conducted on geographies consisting of 363,251,075 people shows a mild positive correlation between the proportion of Peruvians and percentage of population with at least 11th grade education in the United States with a correlation coefficient (R) of 0.302 and weighted average of 91.5%. Similarly, the statistical analysis conducted on geographies consisting of 399,020,036 people shows a moderate negative correlation between the proportion of Salvadorans and percentage of population with at least 11th grade education in the United States with a correlation coefficient (R) of -0.485 and weighted average of 86.2%, a difference of 6.1%.
11th Grade Correlation Summary
| Measurement | Peruvian | Salvadoran |
| Minimum | 80.5% | 58.8% |
| Maximum | 100.0% | 100.0% |
| Range | 19.5% | 41.2% |
| Mean | 92.2% | 82.1% |
| Median | 92.2% | 83.2% |
| Interquartile 25% (IQ1) | 90.1% | 78.3% |
| Interquartile 75% (IQ3) | 94.5% | 86.9% |
| Interquartile Range (IQR) | 4.4% | 8.6% |
| Standard Deviation (Sample) | 4.5% | 6.9% |
| Standard Deviation (Population) | 4.5% | 6.9% |
Similar Demographics by 11th Grade
Demographics Similar to Peruvians by 11th Grade
In terms of 11th grade, the demographic groups most similar to Peruvians are Immigrants from Uzbekistan (91.5%, a difference of 0.0%), Ghanaian (91.5%, a difference of 0.0%), Immigrants from Philippines (91.5%, a difference of 0.010%), Immigrants from Costa Rica (91.4%, a difference of 0.020%), and Immigrants from Nigeria (91.4%, a difference of 0.040%).
| Demographics | Rating | Rank | 11th Grade |
| Immigrants | Middle Africa | 1.6 /100 | #242 | Tragic 91.6% |
| Immigrants | Thailand | 1.4 /100 | #243 | Tragic 91.6% |
| Senegalese | 1.4 /100 | #244 | Tragic 91.6% |
| Africans | 1.3 /100 | #245 | Tragic 91.5% |
| Seminole | 1.2 /100 | #246 | Tragic 91.5% |
| Immigrants | Philippines | 1.0 /100 | #247 | Tragic 91.5% |
| Immigrants | Uzbekistan | 1.0 /100 | #248 | Tragic 91.5% |
| Peruvians | 1.0 /100 | #249 | Tragic 91.5% |
| Ghanaians | 0.9 /100 | #250 | Tragic 91.5% |
| Immigrants | Costa Rica | 0.9 /100 | #251 | Tragic 91.4% |
| Immigrants | Nigeria | 0.8 /100 | #252 | Tragic 91.4% |
| Immigrants | South America | 0.8 /100 | #253 | Tragic 91.4% |
| Immigrants | Eritrea | 0.7 /100 | #254 | Tragic 91.4% |
| Blacks/African Americans | 0.7 /100 | #255 | Tragic 91.4% |
| Immigrants | Senegal | 0.7 /100 | #256 | Tragic 91.4% |
Demographics Similar to Salvadorans by 11th Grade
In terms of 11th grade, the demographic groups most similar to Salvadorans are Mexican (86.1%, a difference of 0.060%), Guatemalan (86.4%, a difference of 0.23%), Immigrants from Guatemala (85.8%, a difference of 0.39%), Immigrants from Latin America (86.8%, a difference of 0.73%), and Immigrants from Dominican Republic (86.9%, a difference of 0.85%).
| Demographics | Rating | Rank | 11th Grade |
| Immigrants | Yemen | 0.0 /100 | #333 | Tragic 87.1% |
| Houma | 0.0 /100 | #334 | Tragic 87.0% |
| Central Americans | 0.0 /100 | #335 | Tragic 86.9% |
| Immigrants | Dominican Republic | 0.0 /100 | #336 | Tragic 86.9% |
| Immigrants | Honduras | 0.0 /100 | #337 | Tragic 86.9% |
| Immigrants | Latin America | 0.0 /100 | #338 | Tragic 86.8% |
| Guatemalans | 0.0 /100 | #339 | Tragic 86.4% |
| Salvadorans | 0.0 /100 | #340 | Tragic 86.2% |
| Mexicans | 0.0 /100 | #341 | Tragic 86.1% |
| Immigrants | Guatemala | 0.0 /100 | #342 | Tragic 85.8% |
| Immigrants | El Salvador | 0.0 /100 | #343 | Tragic 85.3% |
| Yakama | 0.0 /100 | #344 | Tragic 85.0% |
| Immigrants | Central America | 0.0 /100 | #345 | Tragic 84.9% |
| Spanish American Indians | 0.0 /100 | #346 | Tragic 84.7% |
| Immigrants | Mexico | 0.0 /100 | #347 | Tragic 84.5% |