Peruvian vs Russian 11th Grade
COMPARE
Peruvian
Russian
11th Grade
11th Grade Comparison
Peruvians
Russians
91.5%
11TH GRADE
1.0/ 100
METRIC RATING
249th/ 347
METRIC RANK
94.3%
11TH GRADE
100.0/ 100
METRIC RATING
30th/ 347
METRIC RANK
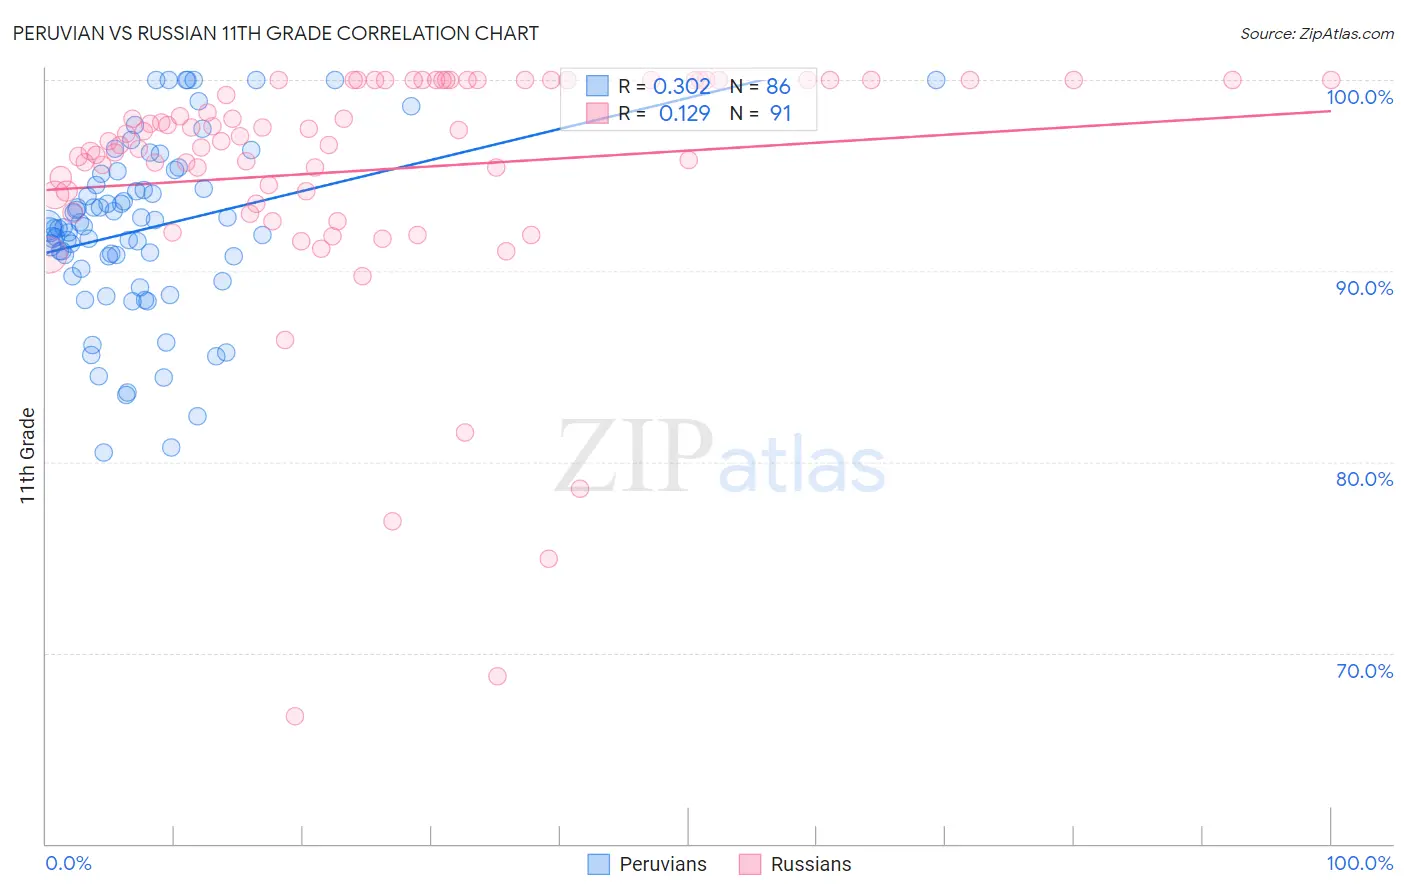
Peruvian vs Russian 11th Grade Correlation Chart
The statistical analysis conducted on geographies consisting of 363,251,075 people shows a mild positive correlation between the proportion of Peruvians and percentage of population with at least 11th grade education in the United States with a correlation coefficient (R) of 0.302 and weighted average of 91.5%. Similarly, the statistical analysis conducted on geographies consisting of 512,259,122 people shows a poor positive correlation between the proportion of Russians and percentage of population with at least 11th grade education in the United States with a correlation coefficient (R) of 0.129 and weighted average of 94.3%, a difference of 3.0%.
11th Grade Correlation Summary
| Measurement | Peruvian | Russian |
| Minimum | 80.5% | 66.7% |
| Maximum | 100.0% | 100.0% |
| Range | 19.5% | 33.3% |
| Mean | 92.2% | 95.3% |
| Median | 92.2% | 96.8% |
| Interquartile 25% (IQ1) | 90.1% | 94.0% |
| Interquartile 75% (IQ3) | 94.5% | 100.0% |
| Interquartile Range (IQR) | 4.4% | 6.0% |
| Standard Deviation (Sample) | 4.5% | 6.5% |
| Standard Deviation (Population) | 4.5% | 6.4% |
Similar Demographics by 11th Grade
Demographics Similar to Peruvians by 11th Grade
In terms of 11th grade, the demographic groups most similar to Peruvians are Immigrants from Uzbekistan (91.5%, a difference of 0.0%), Ghanaian (91.5%, a difference of 0.0%), Immigrants from Philippines (91.5%, a difference of 0.010%), Immigrants from Costa Rica (91.4%, a difference of 0.020%), and Immigrants from Nigeria (91.4%, a difference of 0.040%).
| Demographics | Rating | Rank | 11th Grade |
| Immigrants | Middle Africa | 1.6 /100 | #242 | Tragic 91.6% |
| Immigrants | Thailand | 1.4 /100 | #243 | Tragic 91.6% |
| Senegalese | 1.4 /100 | #244 | Tragic 91.6% |
| Africans | 1.3 /100 | #245 | Tragic 91.5% |
| Seminole | 1.2 /100 | #246 | Tragic 91.5% |
| Immigrants | Philippines | 1.0 /100 | #247 | Tragic 91.5% |
| Immigrants | Uzbekistan | 1.0 /100 | #248 | Tragic 91.5% |
| Peruvians | 1.0 /100 | #249 | Tragic 91.5% |
| Ghanaians | 0.9 /100 | #250 | Tragic 91.5% |
| Immigrants | Costa Rica | 0.9 /100 | #251 | Tragic 91.4% |
| Immigrants | Nigeria | 0.8 /100 | #252 | Tragic 91.4% |
| Immigrants | South America | 0.8 /100 | #253 | Tragic 91.4% |
| Immigrants | Eritrea | 0.7 /100 | #254 | Tragic 91.4% |
| Blacks/African Americans | 0.7 /100 | #255 | Tragic 91.4% |
| Immigrants | Senegal | 0.7 /100 | #256 | Tragic 91.4% |
Demographics Similar to Russians by 11th Grade
In terms of 11th grade, the demographic groups most similar to Russians are Welsh (94.2%, a difference of 0.020%), Belgian (94.2%, a difference of 0.020%), British (94.2%, a difference of 0.050%), Immigrants from Scotland (94.2%, a difference of 0.060%), and Immigrants from Singapore (94.2%, a difference of 0.060%).
| Demographics | Rating | Rank | 11th Grade |
| Czechs | 100.0 /100 | #23 | Exceptional 94.4% |
| English | 100.0 /100 | #24 | Exceptional 94.4% |
| Irish | 100.0 /100 | #25 | Exceptional 94.4% |
| Scottish | 100.0 /100 | #26 | Exceptional 94.4% |
| Europeans | 100.0 /100 | #27 | Exceptional 94.4% |
| Estonians | 100.0 /100 | #28 | Exceptional 94.4% |
| Dutch | 100.0 /100 | #29 | Exceptional 94.3% |
| Russians | 100.0 /100 | #30 | Exceptional 94.3% |
| Welsh | 99.9 /100 | #31 | Exceptional 94.2% |
| Belgians | 99.9 /100 | #32 | Exceptional 94.2% |
| British | 99.9 /100 | #33 | Exceptional 94.2% |
| Immigrants | Scotland | 99.9 /100 | #34 | Exceptional 94.2% |
| Immigrants | Singapore | 99.9 /100 | #35 | Exceptional 94.2% |
| Immigrants | Northern Europe | 99.9 /100 | #36 | Exceptional 94.2% |
| Northern Europeans | 99.9 /100 | #37 | Exceptional 94.2% |