Immigrants from Greece vs Ugandan 11th Grade
COMPARE
Immigrants from Greece
Ugandan
11th Grade
11th Grade Comparison
Immigrants from Greece
Ugandans
93.2%
11TH GRADE
95.9/ 100
METRIC RATING
123rd/ 347
METRIC RANK
92.9%
11TH GRADE
81.4/ 100
METRIC RATING
143rd/ 347
METRIC RANK
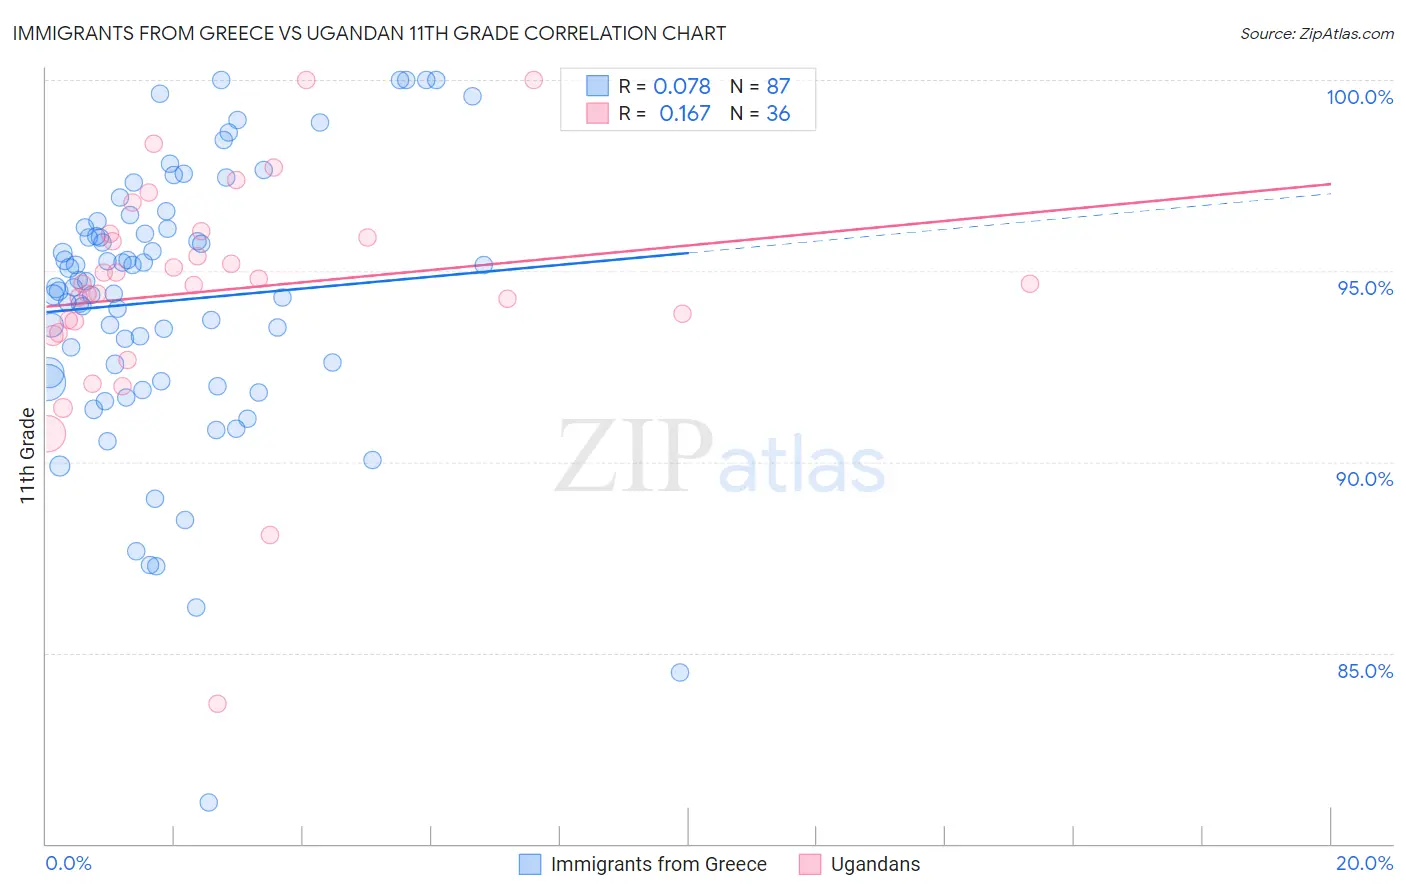
Immigrants from Greece vs Ugandan 11th Grade Correlation Chart
The statistical analysis conducted on geographies consisting of 216,879,847 people shows a slight positive correlation between the proportion of Immigrants from Greece and percentage of population with at least 11th grade education in the United States with a correlation coefficient (R) of 0.078 and weighted average of 93.2%. Similarly, the statistical analysis conducted on geographies consisting of 93,991,892 people shows a poor positive correlation between the proportion of Ugandans and percentage of population with at least 11th grade education in the United States with a correlation coefficient (R) of 0.167 and weighted average of 92.9%, a difference of 0.41%.
11th Grade Correlation Summary
| Measurement | Immigrants from Greece | Ugandan |
| Minimum | 81.1% | 83.7% |
| Maximum | 100.0% | 100.0% |
| Range | 18.9% | 16.3% |
| Mean | 94.2% | 94.5% |
| Median | 94.6% | 94.7% |
| Interquartile 25% (IQ1) | 92.1% | 93.5% |
| Interquartile 75% (IQ3) | 96.1% | 95.9% |
| Interquartile Range (IQR) | 4.0% | 2.4% |
| Standard Deviation (Sample) | 3.6% | 3.0% |
| Standard Deviation (Population) | 3.6% | 3.0% |
Demographics Similar to Immigrants from Greece and Ugandans by 11th Grade
In terms of 11th grade, the demographic groups most similar to Immigrants from Greece are Immigrants from Eastern Europe (93.2%, a difference of 0.0%), Immigrants from Sri Lanka (93.2%, a difference of 0.020%), Basque (93.2%, a difference of 0.040%), Immigrants from Kazakhstan (93.1%, a difference of 0.16%), and Immigrants from Jordan (93.1%, a difference of 0.16%). Similarly, the demographic groups most similar to Ugandans are Kenyan (92.9%, a difference of 0.010%), Venezuelan (92.9%, a difference of 0.030%), Chilean (92.9%, a difference of 0.030%), Crow (92.9%, a difference of 0.050%), and Immigrants from Brazil (92.9%, a difference of 0.060%).
| Demographics | Rating | Rank | 11th Grade |
| Immigrants | Greece | 95.9 /100 | #123 | Exceptional 93.2% |
| Immigrants | Eastern Europe | 95.9 /100 | #124 | Exceptional 93.2% |
| Immigrants | Sri Lanka | 95.6 /100 | #125 | Exceptional 93.2% |
| Basques | 95.2 /100 | #126 | Exceptional 93.2% |
| Immigrants | Kazakhstan | 92.4 /100 | #127 | Exceptional 93.1% |
| Immigrants | Jordan | 92.4 /100 | #128 | Exceptional 93.1% |
| Immigrants | Ukraine | 89.8 /100 | #129 | Excellent 93.0% |
| Albanians | 89.5 /100 | #130 | Excellent 93.0% |
| Egyptians | 89.5 /100 | #131 | Excellent 93.0% |
| Immigrants | Bosnia and Herzegovina | 89.0 /100 | #132 | Excellent 93.0% |
| Mongolians | 87.6 /100 | #133 | Excellent 93.0% |
| Delaware | 87.3 /100 | #134 | Excellent 93.0% |
| Immigrants | Italy | 86.6 /100 | #135 | Excellent 92.9% |
| Cree | 85.9 /100 | #136 | Excellent 92.9% |
| Arabs | 85.4 /100 | #137 | Excellent 92.9% |
| Immigrants | Brazil | 85.1 /100 | #138 | Excellent 92.9% |
| Crow | 84.1 /100 | #139 | Excellent 92.9% |
| Venezuelans | 83.4 /100 | #140 | Excellent 92.9% |
| Chileans | 83.0 /100 | #141 | Excellent 92.9% |
| Kenyans | 82.0 /100 | #142 | Excellent 92.9% |
| Ugandans | 81.4 /100 | #143 | Excellent 92.9% |