Ethiopian vs Ugandan 11th Grade
COMPARE
Ethiopian
Ugandan
11th Grade
11th Grade Comparison
Ethiopians
Ugandans
92.2%
11TH GRADE
18.8/ 100
METRIC RATING
210th/ 347
METRIC RANK
92.9%
11TH GRADE
81.4/ 100
METRIC RATING
143rd/ 347
METRIC RANK
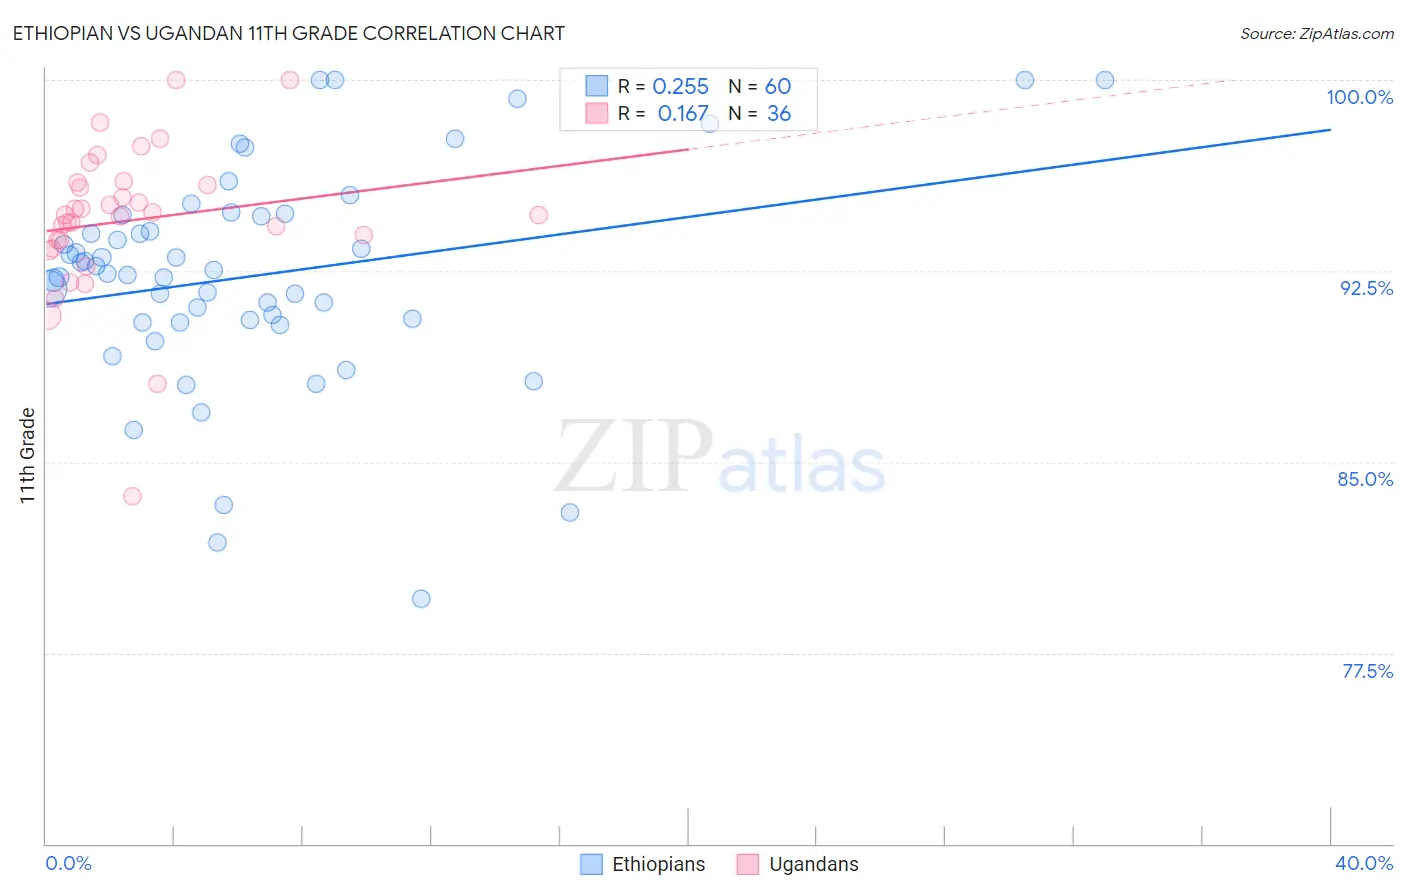
Ethiopian vs Ugandan 11th Grade Correlation Chart
The statistical analysis conducted on geographies consisting of 223,161,778 people shows a weak positive correlation between the proportion of Ethiopians and percentage of population with at least 11th grade education in the United States with a correlation coefficient (R) of 0.255 and weighted average of 92.2%. Similarly, the statistical analysis conducted on geographies consisting of 93,991,892 people shows a poor positive correlation between the proportion of Ugandans and percentage of population with at least 11th grade education in the United States with a correlation coefficient (R) of 0.167 and weighted average of 92.9%, a difference of 0.72%.
11th Grade Correlation Summary
| Measurement | Ethiopian | Ugandan |
| Minimum | 79.6% | 83.7% |
| Maximum | 100.0% | 100.0% |
| Range | 20.4% | 16.3% |
| Mean | 92.3% | 94.5% |
| Median | 92.5% | 94.7% |
| Interquartile 25% (IQ1) | 90.5% | 93.5% |
| Interquartile 75% (IQ3) | 94.7% | 95.9% |
| Interquartile Range (IQR) | 4.1% | 2.4% |
| Standard Deviation (Sample) | 4.3% | 3.0% |
| Standard Deviation (Population) | 4.3% | 3.0% |
Similar Demographics by 11th Grade
Demographics Similar to Ethiopians by 11th Grade
In terms of 11th grade, the demographic groups most similar to Ethiopians are Tongan (92.2%, a difference of 0.010%), Immigrants from Micronesia (92.2%, a difference of 0.020%), Colville (92.2%, a difference of 0.040%), Immigrants from Oceania (92.2%, a difference of 0.050%), and Immigrants from Sudan (92.3%, a difference of 0.070%).
| Demographics | Rating | Rank | 11th Grade |
| Immigrants | Sudan | 23.5 /100 | #203 | Fair 92.3% |
| Immigrants | Hong Kong | 23.3 /100 | #204 | Fair 92.2% |
| Kiowa | 23.2 /100 | #205 | Fair 92.2% |
| Bolivians | 23.2 /100 | #206 | Fair 92.2% |
| Immigrants | Oceania | 22.4 /100 | #207 | Fair 92.2% |
| Colville | 21.8 /100 | #208 | Fair 92.2% |
| Tongans | 19.8 /100 | #209 | Poor 92.2% |
| Ethiopians | 18.8 /100 | #210 | Poor 92.2% |
| Immigrants | Micronesia | 17.7 /100 | #211 | Poor 92.2% |
| Koreans | 14.4 /100 | #212 | Poor 92.1% |
| Immigrants | Ethiopia | 13.9 /100 | #213 | Poor 92.1% |
| Afghans | 12.8 /100 | #214 | Poor 92.1% |
| Immigrants | Southern Europe | 12.5 /100 | #215 | Poor 92.1% |
| Somalis | 11.6 /100 | #216 | Poor 92.1% |
| Immigrants | Sierra Leone | 11.1 /100 | #217 | Poor 92.0% |
Demographics Similar to Ugandans by 11th Grade
In terms of 11th grade, the demographic groups most similar to Ugandans are Kenyan (92.9%, a difference of 0.010%), Assyrian/Chaldean/Syriac (92.8%, a difference of 0.020%), Venezuelan (92.9%, a difference of 0.030%), Chilean (92.9%, a difference of 0.030%), and Pakistani (92.8%, a difference of 0.030%).
| Demographics | Rating | Rank | 11th Grade |
| Cree | 85.9 /100 | #136 | Excellent 92.9% |
| Arabs | 85.4 /100 | #137 | Excellent 92.9% |
| Immigrants | Brazil | 85.1 /100 | #138 | Excellent 92.9% |
| Crow | 84.1 /100 | #139 | Excellent 92.9% |
| Venezuelans | 83.4 /100 | #140 | Excellent 92.9% |
| Chileans | 83.0 /100 | #141 | Excellent 92.9% |
| Kenyans | 82.0 /100 | #142 | Excellent 92.9% |
| Ugandans | 81.4 /100 | #143 | Excellent 92.9% |
| Assyrians/Chaldeans/Syriacs | 80.5 /100 | #144 | Excellent 92.8% |
| Pakistanis | 79.6 /100 | #145 | Good 92.8% |
| Iroquois | 79.1 /100 | #146 | Good 92.8% |
| Immigrants | Kenya | 78.7 /100 | #147 | Good 92.8% |
| Hmong | 78.6 /100 | #148 | Good 92.8% |
| Immigrants | Poland | 78.5 /100 | #149 | Good 92.8% |
| Immigrants | Egypt | 77.5 /100 | #150 | Good 92.8% |