Peruvian vs Immigrants from Southern Europe 11th Grade
COMPARE
Peruvian
Immigrants from Southern Europe
11th Grade
11th Grade Comparison
Peruvians
Immigrants from Southern Europe
91.5%
11TH GRADE
1.0/ 100
METRIC RATING
249th/ 347
METRIC RANK
92.1%
11TH GRADE
12.5/ 100
METRIC RATING
215th/ 347
METRIC RANK
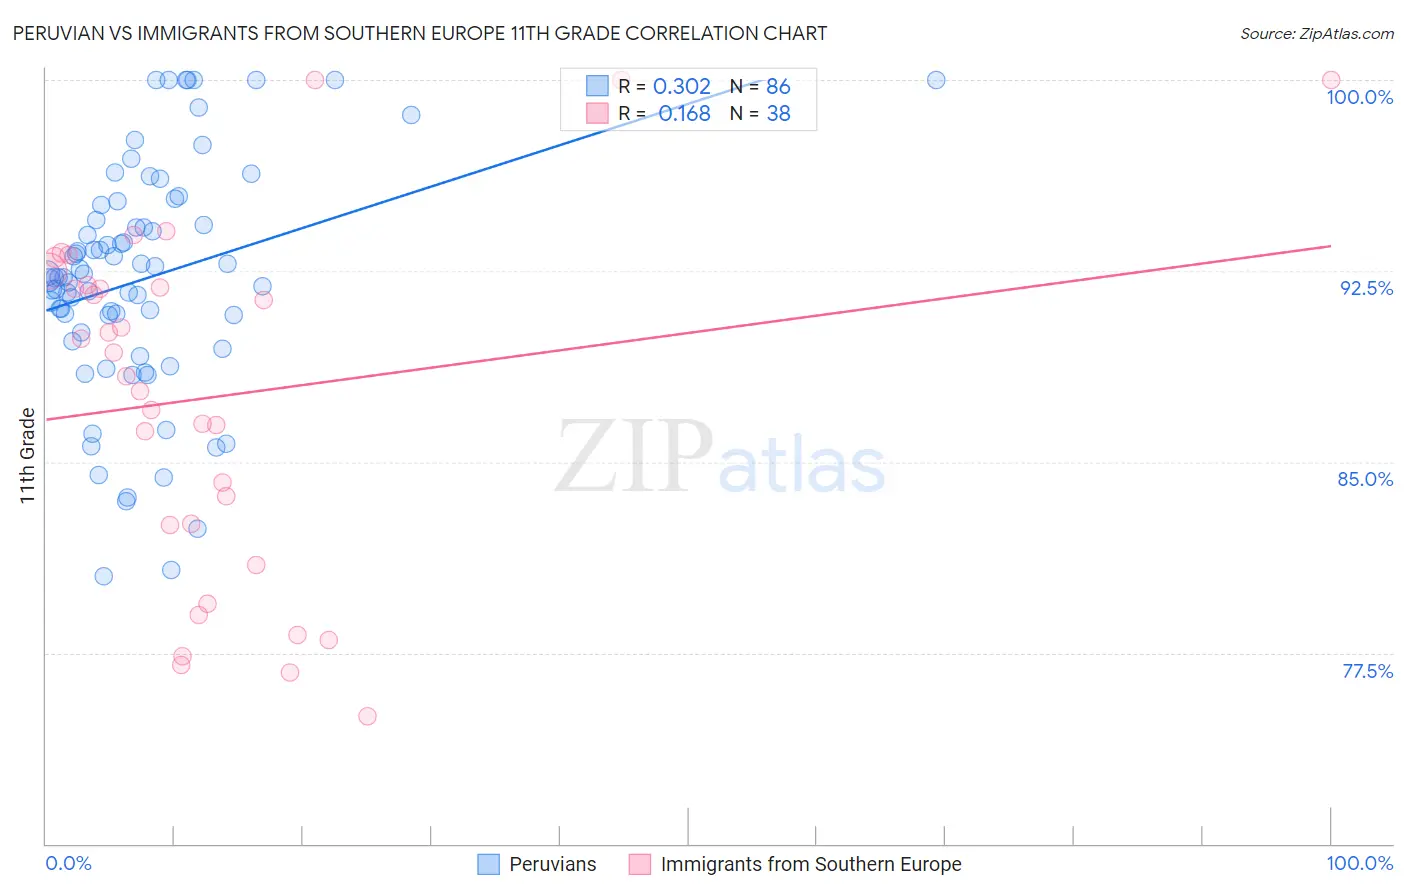
Peruvian vs Immigrants from Southern Europe 11th Grade Correlation Chart
The statistical analysis conducted on geographies consisting of 363,251,075 people shows a mild positive correlation between the proportion of Peruvians and percentage of population with at least 11th grade education in the United States with a correlation coefficient (R) of 0.302 and weighted average of 91.5%. Similarly, the statistical analysis conducted on geographies consisting of 402,804,595 people shows a poor positive correlation between the proportion of Immigrants from Southern Europe and percentage of population with at least 11th grade education in the United States with a correlation coefficient (R) of 0.168 and weighted average of 92.1%, a difference of 0.67%.
11th Grade Correlation Summary
| Measurement | Peruvian | Immigrants from Southern Europe |
| Minimum | 80.5% | 75.0% |
| Maximum | 100.0% | 100.0% |
| Range | 19.5% | 25.0% |
| Mean | 92.2% | 87.5% |
| Median | 92.2% | 88.8% |
| Interquartile 25% (IQ1) | 90.1% | 82.5% |
| Interquartile 75% (IQ3) | 94.5% | 92.0% |
| Interquartile Range (IQR) | 4.4% | 9.4% |
| Standard Deviation (Sample) | 4.5% | 6.8% |
| Standard Deviation (Population) | 4.5% | 6.7% |
Similar Demographics by 11th Grade
Demographics Similar to Peruvians by 11th Grade
In terms of 11th grade, the demographic groups most similar to Peruvians are Immigrants from Uzbekistan (91.5%, a difference of 0.0%), Ghanaian (91.5%, a difference of 0.0%), Immigrants from Philippines (91.5%, a difference of 0.010%), Immigrants from Costa Rica (91.4%, a difference of 0.020%), and Immigrants from Nigeria (91.4%, a difference of 0.040%).
| Demographics | Rating | Rank | 11th Grade |
| Immigrants | Middle Africa | 1.6 /100 | #242 | Tragic 91.6% |
| Immigrants | Thailand | 1.4 /100 | #243 | Tragic 91.6% |
| Senegalese | 1.4 /100 | #244 | Tragic 91.6% |
| Africans | 1.3 /100 | #245 | Tragic 91.5% |
| Seminole | 1.2 /100 | #246 | Tragic 91.5% |
| Immigrants | Philippines | 1.0 /100 | #247 | Tragic 91.5% |
| Immigrants | Uzbekistan | 1.0 /100 | #248 | Tragic 91.5% |
| Peruvians | 1.0 /100 | #249 | Tragic 91.5% |
| Ghanaians | 0.9 /100 | #250 | Tragic 91.5% |
| Immigrants | Costa Rica | 0.9 /100 | #251 | Tragic 91.4% |
| Immigrants | Nigeria | 0.8 /100 | #252 | Tragic 91.4% |
| Immigrants | South America | 0.8 /100 | #253 | Tragic 91.4% |
| Immigrants | Eritrea | 0.7 /100 | #254 | Tragic 91.4% |
| Blacks/African Americans | 0.7 /100 | #255 | Tragic 91.4% |
| Immigrants | Senegal | 0.7 /100 | #256 | Tragic 91.4% |
Demographics Similar to Immigrants from Southern Europe by 11th Grade
In terms of 11th grade, the demographic groups most similar to Immigrants from Southern Europe are Afghan (92.1%, a difference of 0.010%), Somali (92.1%, a difference of 0.020%), Immigrants from Ethiopia (92.1%, a difference of 0.030%), Immigrants from Sierra Leone (92.0%, a difference of 0.030%), and Korean (92.1%, a difference of 0.040%).
| Demographics | Rating | Rank | 11th Grade |
| Colville | 21.8 /100 | #208 | Fair 92.2% |
| Tongans | 19.8 /100 | #209 | Poor 92.2% |
| Ethiopians | 18.8 /100 | #210 | Poor 92.2% |
| Immigrants | Micronesia | 17.7 /100 | #211 | Poor 92.2% |
| Koreans | 14.4 /100 | #212 | Poor 92.1% |
| Immigrants | Ethiopia | 13.9 /100 | #213 | Poor 92.1% |
| Afghans | 12.8 /100 | #214 | Poor 92.1% |
| Immigrants | Southern Europe | 12.5 /100 | #215 | Poor 92.1% |
| Somalis | 11.6 /100 | #216 | Poor 92.1% |
| Immigrants | Sierra Leone | 11.1 /100 | #217 | Poor 92.0% |
| Blackfeet | 10.1 /100 | #218 | Poor 92.0% |
| Portuguese | 10.0 /100 | #219 | Tragic 92.0% |
| South American Indians | 7.6 /100 | #220 | Tragic 92.0% |
| Immigrants | Liberia | 7.0 /100 | #221 | Tragic 91.9% |
| Immigrants | Africa | 6.5 /100 | #222 | Tragic 91.9% |