Thai vs Russian 11th Grade
COMPARE
Thai
Russian
11th Grade
11th Grade Comparison
Thais
Russians
94.1%
11TH GRADE
99.9/ 100
METRIC RATING
40th/ 347
METRIC RANK
94.3%
11TH GRADE
100.0/ 100
METRIC RATING
30th/ 347
METRIC RANK
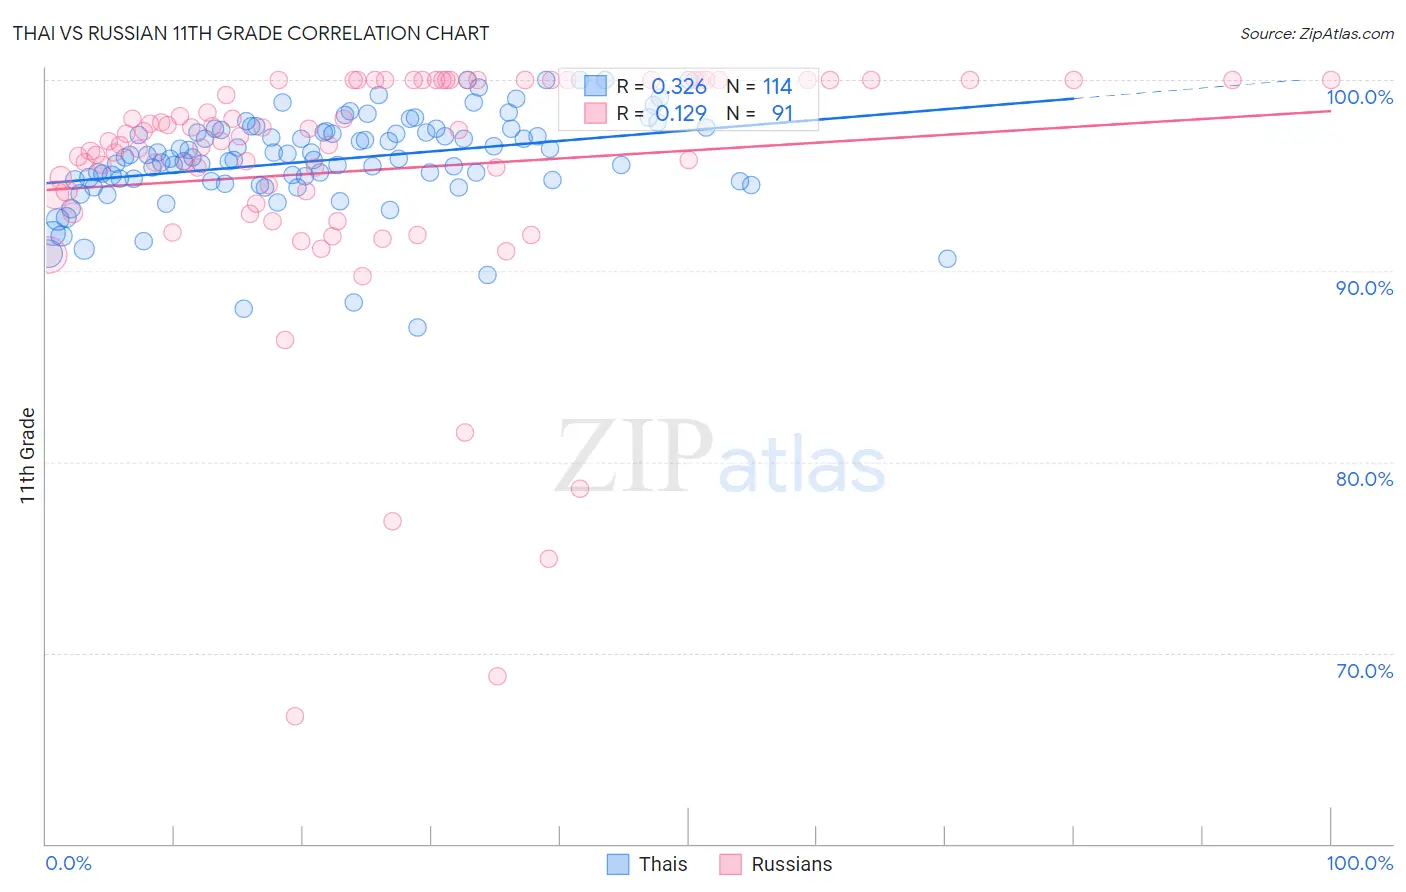
Thai vs Russian 11th Grade Correlation Chart
The statistical analysis conducted on geographies consisting of 475,814,962 people shows a mild positive correlation between the proportion of Thais and percentage of population with at least 11th grade education in the United States with a correlation coefficient (R) of 0.326 and weighted average of 94.1%. Similarly, the statistical analysis conducted on geographies consisting of 512,259,122 people shows a poor positive correlation between the proportion of Russians and percentage of population with at least 11th grade education in the United States with a correlation coefficient (R) of 0.129 and weighted average of 94.3%, a difference of 0.14%.
11th Grade Correlation Summary
| Measurement | Thai | Russian |
| Minimum | 87.0% | 66.7% |
| Maximum | 100.0% | 100.0% |
| Range | 13.0% | 33.3% |
| Mean | 95.8% | 95.3% |
| Median | 95.9% | 96.8% |
| Interquartile 25% (IQ1) | 94.7% | 94.0% |
| Interquartile 75% (IQ3) | 97.3% | 100.0% |
| Interquartile Range (IQR) | 2.6% | 6.0% |
| Standard Deviation (Sample) | 2.5% | 6.5% |
| Standard Deviation (Population) | 2.5% | 6.4% |
Demographics Similar to Thais and Russians by 11th Grade
In terms of 11th grade, the demographic groups most similar to Thais are Immigrants from Lithuania (94.1%, a difference of 0.0%), Cypriot (94.1%, a difference of 0.010%), Immigrants from Austria (94.1%, a difference of 0.020%), Greek (94.1%, a difference of 0.020%), and Immigrants from Ireland (94.1%, a difference of 0.030%). Similarly, the demographic groups most similar to Russians are Welsh (94.2%, a difference of 0.020%), Belgian (94.2%, a difference of 0.020%), British (94.2%, a difference of 0.050%), Immigrants from Scotland (94.2%, a difference of 0.060%), and Immigrants from Singapore (94.2%, a difference of 0.060%).
| Demographics | Rating | Rank | 11th Grade |
| Irish | 100.0 /100 | #25 | Exceptional 94.4% |
| Scottish | 100.0 /100 | #26 | Exceptional 94.4% |
| Europeans | 100.0 /100 | #27 | Exceptional 94.4% |
| Estonians | 100.0 /100 | #28 | Exceptional 94.4% |
| Dutch | 100.0 /100 | #29 | Exceptional 94.3% |
| Russians | 100.0 /100 | #30 | Exceptional 94.3% |
| Welsh | 99.9 /100 | #31 | Exceptional 94.2% |
| Belgians | 99.9 /100 | #32 | Exceptional 94.2% |
| British | 99.9 /100 | #33 | Exceptional 94.2% |
| Immigrants | Scotland | 99.9 /100 | #34 | Exceptional 94.2% |
| Immigrants | Singapore | 99.9 /100 | #35 | Exceptional 94.2% |
| Immigrants | Northern Europe | 99.9 /100 | #36 | Exceptional 94.2% |
| Northern Europeans | 99.9 /100 | #37 | Exceptional 94.2% |
| Hungarians | 99.9 /100 | #38 | Exceptional 94.2% |
| Immigrants | Lithuania | 99.9 /100 | #39 | Exceptional 94.1% |
| Thais | 99.9 /100 | #40 | Exceptional 94.1% |
| Cypriots | 99.9 /100 | #41 | Exceptional 94.1% |
| Immigrants | Austria | 99.9 /100 | #42 | Exceptional 94.1% |
| Greeks | 99.9 /100 | #43 | Exceptional 94.1% |
| Immigrants | Ireland | 99.9 /100 | #44 | Exceptional 94.1% |
| Australians | 99.9 /100 | #45 | Exceptional 94.1% |