Polish vs Immigrants from Chile Professional Degree
COMPARE
Polish
Immigrants from Chile
Professional Degree
Professional Degree Comparison
Poles
Immigrants from Chile
4.6%
PROFESSIONAL DEGREE
72.6/ 100
METRIC RATING
151st/ 347
METRIC RANK
5.3%
PROFESSIONAL DEGREE
99.5/ 100
METRIC RATING
87th/ 347
METRIC RANK
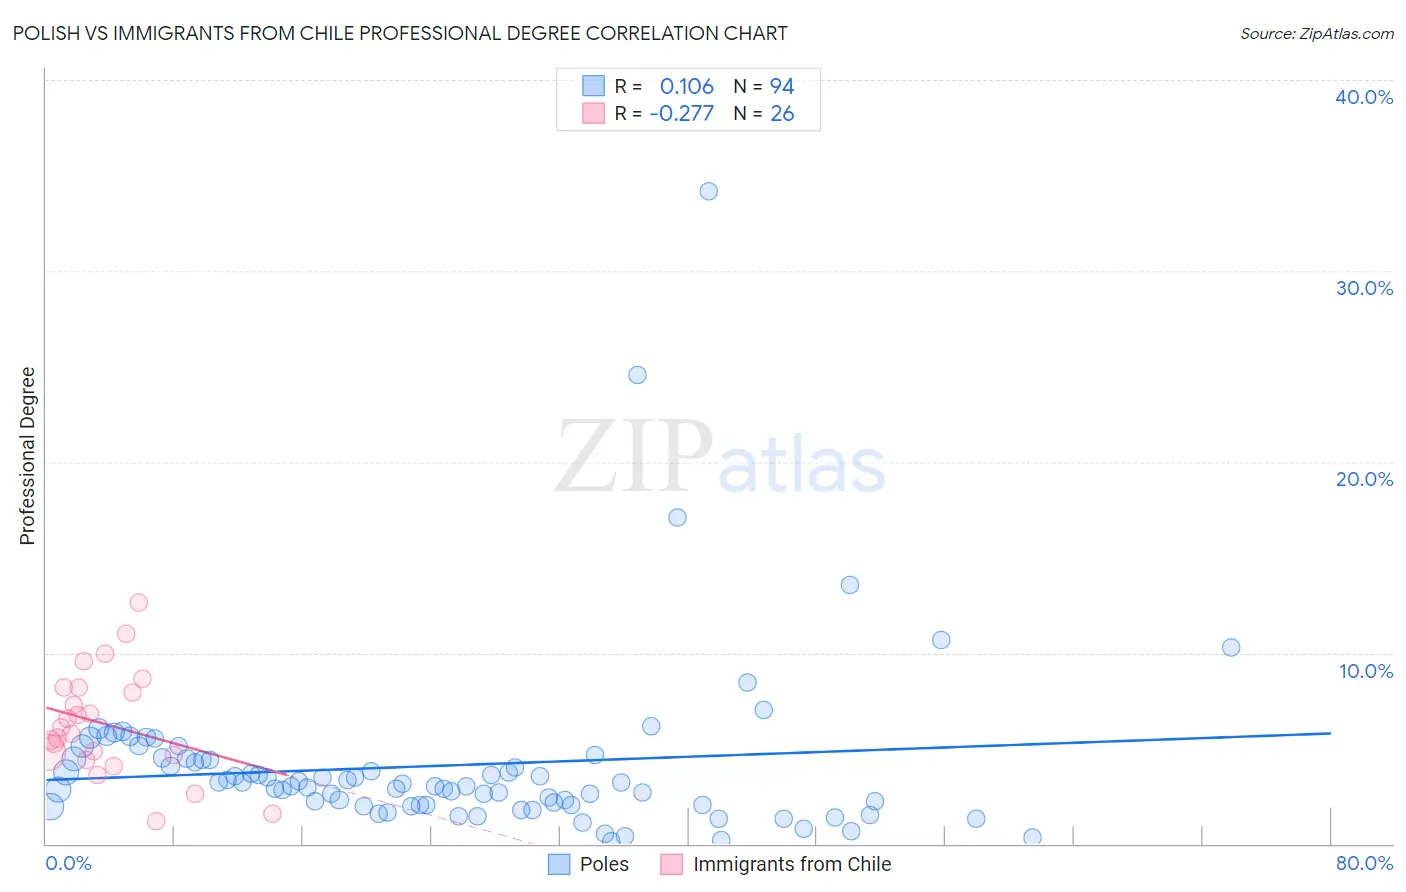
Polish vs Immigrants from Chile Professional Degree Correlation Chart
The statistical analysis conducted on geographies consisting of 553,734,682 people shows a poor positive correlation between the proportion of Poles and percentage of population with at least professional degree education in the United States with a correlation coefficient (R) of 0.106 and weighted average of 4.6%. Similarly, the statistical analysis conducted on geographies consisting of 218,541,106 people shows a weak negative correlation between the proportion of Immigrants from Chile and percentage of population with at least professional degree education in the United States with a correlation coefficient (R) of -0.277 and weighted average of 5.3%, a difference of 15.4%.
Professional Degree Correlation Summary
| Measurement | Polish | Immigrants from Chile |
| Minimum | 0.12% | 1.2% |
| Maximum | 34.2% | 12.6% |
| Range | 34.0% | 11.5% |
| Mean | 4.1% | 6.3% |
| Median | 3.1% | 5.9% |
| Interquartile 25% (IQ1) | 2.0% | 4.7% |
| Interquartile 75% (IQ3) | 4.4% | 8.2% |
| Interquartile Range (IQR) | 2.4% | 3.5% |
| Standard Deviation (Sample) | 4.6% | 2.8% |
| Standard Deviation (Population) | 4.6% | 2.7% |
Similar Demographics by Professional Degree
Demographics Similar to Poles by Professional Degree
In terms of professional degree, the demographic groups most similar to Poles are Immigrants from Africa (4.6%, a difference of 0.010%), Immigrants from Uruguay (4.6%, a difference of 0.020%), Immigrants from Oceania (4.6%, a difference of 0.14%), Scottish (4.6%, a difference of 0.14%), and Slavic (4.5%, a difference of 0.31%).
| Demographics | Rating | Rank | Professional Degree |
| Immigrants | South America | 80.5 /100 | #144 | Excellent 4.6% |
| Uruguayans | 80.2 /100 | #145 | Excellent 4.6% |
| Luxembourgers | 78.7 /100 | #146 | Good 4.6% |
| Colombians | 77.7 /100 | #147 | Good 4.6% |
| Slovenes | 76.1 /100 | #148 | Good 4.6% |
| Senegalese | 75.3 /100 | #149 | Good 4.6% |
| Immigrants | Oceania | 73.4 /100 | #150 | Good 4.6% |
| Poles | 72.6 /100 | #151 | Good 4.6% |
| Immigrants | Africa | 72.5 /100 | #152 | Good 4.6% |
| Immigrants | Uruguay | 72.5 /100 | #153 | Good 4.6% |
| Scottish | 71.8 /100 | #154 | Good 4.6% |
| Slavs | 70.8 /100 | #155 | Good 4.5% |
| Swedes | 69.9 /100 | #156 | Good 4.5% |
| Iraqis | 69.8 /100 | #157 | Good 4.5% |
| Immigrants | Armenia | 68.8 /100 | #158 | Good 4.5% |
Demographics Similar to Immigrants from Chile by Professional Degree
In terms of professional degree, the demographic groups most similar to Immigrants from Chile are Immigrants from Zimbabwe (5.3%, a difference of 0.11%), Greek (5.3%, a difference of 0.11%), Carpatho Rusyn (5.3%, a difference of 0.13%), Immigrants from Croatia (5.3%, a difference of 0.13%), and Egyptian (5.3%, a difference of 0.14%).
| Demographics | Rating | Rank | Professional Degree |
| Immigrants | England | 99.6 /100 | #80 | Exceptional 5.3% |
| Immigrants | Brazil | 99.6 /100 | #81 | Exceptional 5.3% |
| Romanians | 99.6 /100 | #82 | Exceptional 5.3% |
| Carpatho Rusyns | 99.6 /100 | #83 | Exceptional 5.3% |
| Immigrants | Croatia | 99.6 /100 | #84 | Exceptional 5.3% |
| Immigrants | Zimbabwe | 99.6 /100 | #85 | Exceptional 5.3% |
| Greeks | 99.6 /100 | #86 | Exceptional 5.3% |
| Immigrants | Chile | 99.5 /100 | #87 | Exceptional 5.3% |
| Egyptians | 99.5 /100 | #88 | Exceptional 5.3% |
| Chileans | 99.5 /100 | #89 | Exceptional 5.3% |
| Immigrants | Scotland | 99.5 /100 | #90 | Exceptional 5.3% |
| Laotians | 99.5 /100 | #91 | Exceptional 5.2% |
| Immigrants | Eastern Europe | 99.5 /100 | #92 | Exceptional 5.2% |
| Northern Europeans | 99.3 /100 | #93 | Exceptional 5.2% |
| Alsatians | 99.3 /100 | #94 | Exceptional 5.2% |