Pennsylvania German vs Central American Indian Doctorate Degree
COMPARE
Pennsylvania German
Central American Indian
Doctorate Degree
Doctorate Degree Comparison
Pennsylvania Germans
Central American Indians
1.4%
DOCTORATE DEGREE
0.1/ 100
METRIC RATING
305th/ 347
METRIC RANK
1.5%
DOCTORATE DEGREE
1.0/ 100
METRIC RATING
256th/ 347
METRIC RANK
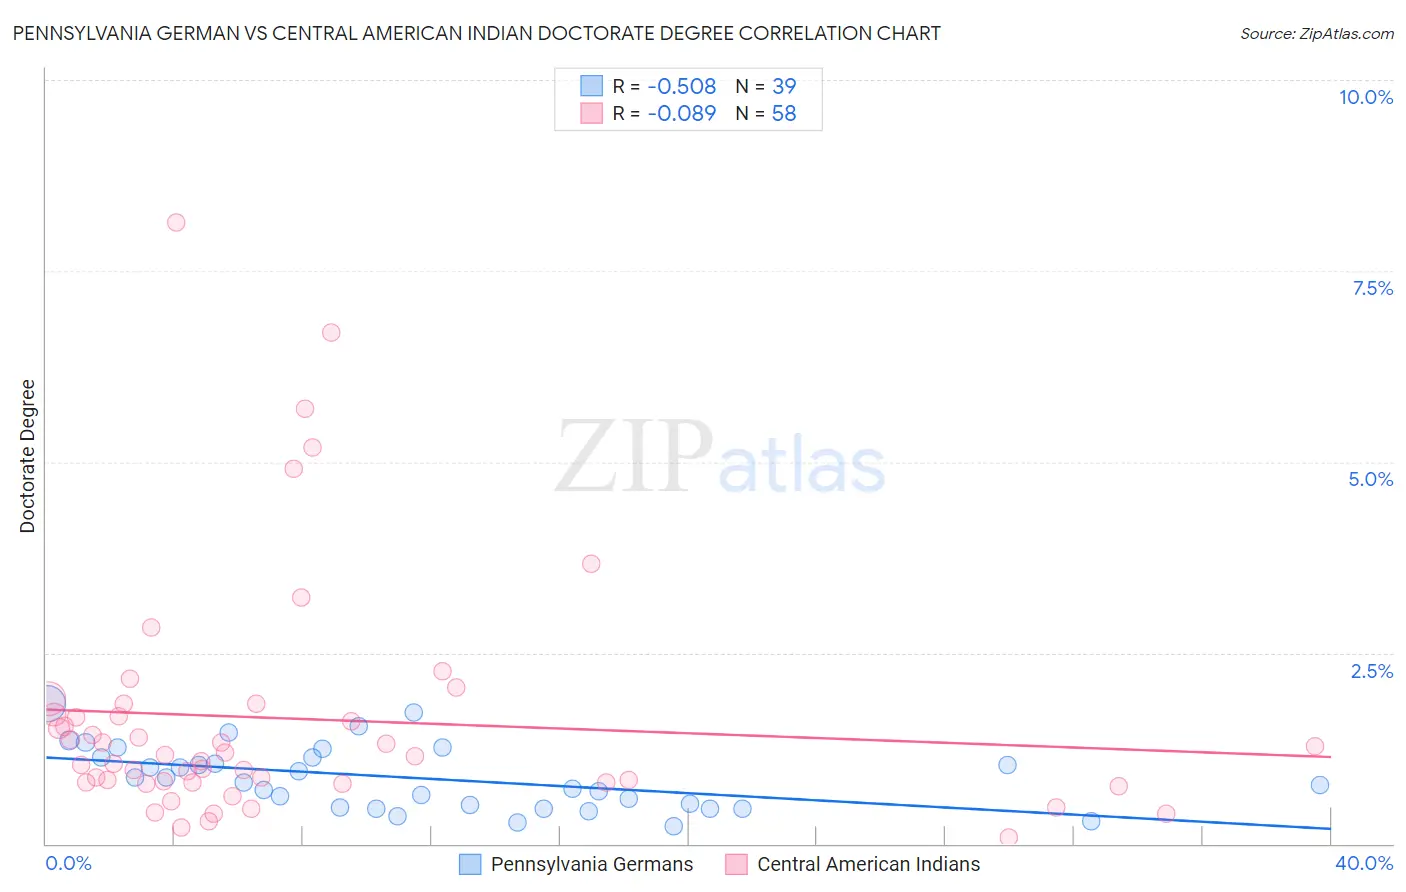
Pennsylvania German vs Central American Indian Doctorate Degree Correlation Chart
The statistical analysis conducted on geographies consisting of 230,381,688 people shows a substantial negative correlation between the proportion of Pennsylvania Germans and percentage of population with at least doctorate degree education in the United States with a correlation coefficient (R) of -0.508 and weighted average of 1.4%. Similarly, the statistical analysis conducted on geographies consisting of 323,048,918 people shows a slight negative correlation between the proportion of Central American Indians and percentage of population with at least doctorate degree education in the United States with a correlation coefficient (R) of -0.089 and weighted average of 1.5%, a difference of 10.7%.
Doctorate Degree Correlation Summary
| Measurement | Pennsylvania German | Central American Indian |
| Minimum | 0.24% | 0.089% |
| Maximum | 1.8% | 8.1% |
| Range | 1.6% | 8.0% |
| Mean | 0.86% | 1.6% |
| Median | 0.80% | 1.2% |
| Interquartile 25% (IQ1) | 0.48% | 0.81% |
| Interquartile 75% (IQ3) | 1.1% | 1.7% |
| Interquartile Range (IQR) | 0.65% | 0.88% |
| Standard Deviation (Sample) | 0.41% | 1.6% |
| Standard Deviation (Population) | 0.41% | 1.6% |
Similar Demographics by Doctorate Degree
Demographics Similar to Pennsylvania Germans by Doctorate Degree
In terms of doctorate degree, the demographic groups most similar to Pennsylvania Germans are Guyanese (1.4%, a difference of 0.010%), Mexican American Indian (1.4%, a difference of 0.13%), Immigrants from Dominica (1.4%, a difference of 0.19%), Shoshone (1.4%, a difference of 0.22%), and Cuban (1.4%, a difference of 0.26%).
| Demographics | Rating | Rank | Doctorate Degree |
| Puerto Ricans | 0.1 /100 | #298 | Tragic 1.4% |
| Belizeans | 0.1 /100 | #299 | Tragic 1.4% |
| Immigrants | Guatemala | 0.1 /100 | #300 | Tragic 1.4% |
| Hondurans | 0.1 /100 | #301 | Tragic 1.4% |
| Shoshone | 0.1 /100 | #302 | Tragic 1.4% |
| Immigrants | Dominica | 0.1 /100 | #303 | Tragic 1.4% |
| Mexican American Indians | 0.1 /100 | #304 | Tragic 1.4% |
| Pennsylvania Germans | 0.1 /100 | #305 | Tragic 1.4% |
| Guyanese | 0.1 /100 | #306 | Tragic 1.4% |
| Cubans | 0.1 /100 | #307 | Tragic 1.4% |
| Immigrants | Laos | 0.1 /100 | #308 | Tragic 1.4% |
| Immigrants | Grenada | 0.1 /100 | #309 | Tragic 1.4% |
| Immigrants | Jamaica | 0.1 /100 | #310 | Tragic 1.4% |
| Immigrants | Honduras | 0.1 /100 | #311 | Tragic 1.4% |
| Immigrants | Nicaragua | 0.1 /100 | #312 | Tragic 1.4% |
Demographics Similar to Central American Indians by Doctorate Degree
In terms of doctorate degree, the demographic groups most similar to Central American Indians are Immigrants from Cambodia (1.5%, a difference of 0.050%), Trinidadian and Tobagonian (1.5%, a difference of 0.050%), American (1.5%, a difference of 0.18%), Chippewa (1.5%, a difference of 0.22%), and Yuman (1.5%, a difference of 0.33%).
| Demographics | Rating | Rank | Doctorate Degree |
| Potawatomi | 1.6 /100 | #249 | Tragic 1.6% |
| Immigrants | Fiji | 1.6 /100 | #250 | Tragic 1.6% |
| Apache | 1.3 /100 | #251 | Tragic 1.5% |
| Yuman | 1.1 /100 | #252 | Tragic 1.5% |
| Americans | 1.0 /100 | #253 | Tragic 1.5% |
| Immigrants | Cambodia | 1.0 /100 | #254 | Tragic 1.5% |
| Trinidadians and Tobagonians | 1.0 /100 | #255 | Tragic 1.5% |
| Central American Indians | 1.0 /100 | #256 | Tragic 1.5% |
| Chippewa | 0.9 /100 | #257 | Tragic 1.5% |
| Immigrants | West Indies | 0.9 /100 | #258 | Tragic 1.5% |
| Liberians | 0.9 /100 | #259 | Tragic 1.5% |
| Japanese | 0.9 /100 | #260 | Tragic 1.5% |
| Immigrants | Portugal | 0.8 /100 | #261 | Tragic 1.5% |
| Chickasaw | 0.7 /100 | #262 | Tragic 1.5% |
| Immigrants | Bahamas | 0.7 /100 | #263 | Tragic 1.5% |