Pennsylvania German vs Immigrants from Western Africa Doctorate Degree
COMPARE
Pennsylvania German
Immigrants from Western Africa
Doctorate Degree
Doctorate Degree Comparison
Pennsylvania Germans
Immigrants from Western Africa
1.4%
DOCTORATE DEGREE
0.1/ 100
METRIC RATING
305th/ 347
METRIC RANK
1.7%
DOCTORATE DEGREE
15.4/ 100
METRIC RATING
209th/ 347
METRIC RANK
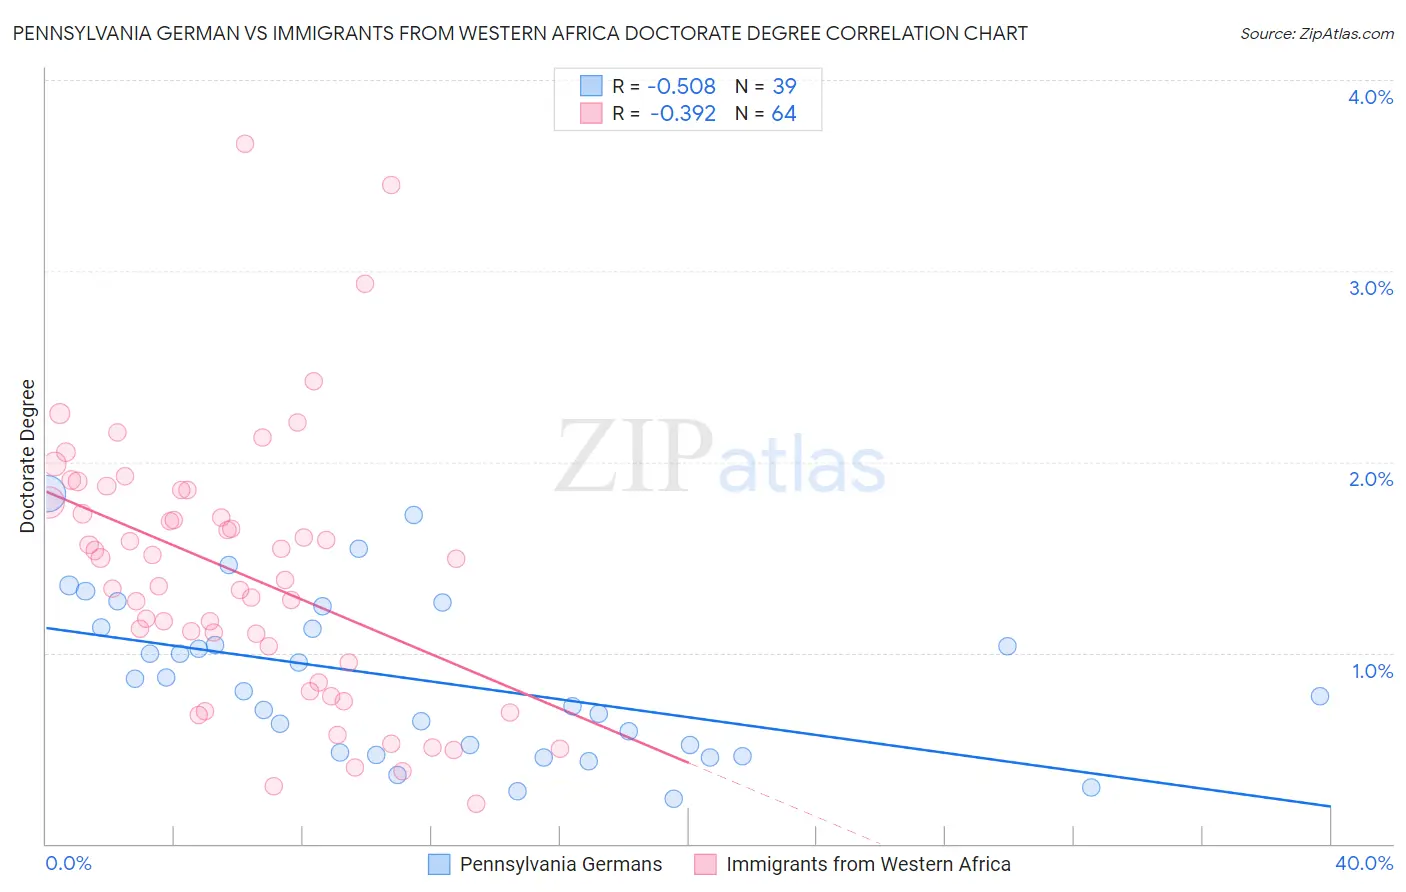
Pennsylvania German vs Immigrants from Western Africa Doctorate Degree Correlation Chart
The statistical analysis conducted on geographies consisting of 230,381,688 people shows a substantial negative correlation between the proportion of Pennsylvania Germans and percentage of population with at least doctorate degree education in the United States with a correlation coefficient (R) of -0.508 and weighted average of 1.4%. Similarly, the statistical analysis conducted on geographies consisting of 355,297,705 people shows a mild negative correlation between the proportion of Immigrants from Western Africa and percentage of population with at least doctorate degree education in the United States with a correlation coefficient (R) of -0.392 and weighted average of 1.7%, a difference of 24.9%.
Doctorate Degree Correlation Summary
| Measurement | Pennsylvania German | Immigrants from Western Africa |
| Minimum | 0.24% | 0.21% |
| Maximum | 1.8% | 3.7% |
| Range | 1.6% | 3.5% |
| Mean | 0.86% | 1.4% |
| Median | 0.80% | 1.4% |
| Interquartile 25% (IQ1) | 0.48% | 0.90% |
| Interquartile 75% (IQ3) | 1.1% | 1.8% |
| Interquartile Range (IQR) | 0.65% | 0.92% |
| Standard Deviation (Sample) | 0.41% | 0.70% |
| Standard Deviation (Population) | 0.41% | 0.69% |
Similar Demographics by Doctorate Degree
Demographics Similar to Pennsylvania Germans by Doctorate Degree
In terms of doctorate degree, the demographic groups most similar to Pennsylvania Germans are Guyanese (1.4%, a difference of 0.010%), Mexican American Indian (1.4%, a difference of 0.13%), Immigrants from Dominica (1.4%, a difference of 0.19%), Shoshone (1.4%, a difference of 0.22%), and Cuban (1.4%, a difference of 0.26%).
| Demographics | Rating | Rank | Doctorate Degree |
| Puerto Ricans | 0.1 /100 | #298 | Tragic 1.4% |
| Belizeans | 0.1 /100 | #299 | Tragic 1.4% |
| Immigrants | Guatemala | 0.1 /100 | #300 | Tragic 1.4% |
| Hondurans | 0.1 /100 | #301 | Tragic 1.4% |
| Shoshone | 0.1 /100 | #302 | Tragic 1.4% |
| Immigrants | Dominica | 0.1 /100 | #303 | Tragic 1.4% |
| Mexican American Indians | 0.1 /100 | #304 | Tragic 1.4% |
| Pennsylvania Germans | 0.1 /100 | #305 | Tragic 1.4% |
| Guyanese | 0.1 /100 | #306 | Tragic 1.4% |
| Cubans | 0.1 /100 | #307 | Tragic 1.4% |
| Immigrants | Laos | 0.1 /100 | #308 | Tragic 1.4% |
| Immigrants | Grenada | 0.1 /100 | #309 | Tragic 1.4% |
| Immigrants | Jamaica | 0.1 /100 | #310 | Tragic 1.4% |
| Immigrants | Honduras | 0.1 /100 | #311 | Tragic 1.4% |
| Immigrants | Nicaragua | 0.1 /100 | #312 | Tragic 1.4% |
Demographics Similar to Immigrants from Western Africa by Doctorate Degree
In terms of doctorate degree, the demographic groups most similar to Immigrants from Western Africa are Tongan (1.7%, a difference of 0.080%), Immigrants from Armenia (1.7%, a difference of 0.10%), Colombian (1.7%, a difference of 0.19%), Immigrants from South Eastern Asia (1.7%, a difference of 0.22%), and Korean (1.7%, a difference of 0.37%).
| Demographics | Rating | Rank | Doctorate Degree |
| Portuguese | 21.4 /100 | #202 | Fair 1.8% |
| Immigrants | Vietnam | 21.4 /100 | #203 | Fair 1.8% |
| Somalis | 21.2 /100 | #204 | Fair 1.7% |
| Venezuelans | 19.5 /100 | #205 | Poor 1.7% |
| Immigrants | Peru | 17.6 /100 | #206 | Poor 1.7% |
| Yugoslavians | 17.1 /100 | #207 | Poor 1.7% |
| Colombians | 16.1 /100 | #208 | Poor 1.7% |
| Immigrants | Western Africa | 15.4 /100 | #209 | Poor 1.7% |
| Tongans | 15.1 /100 | #210 | Poor 1.7% |
| Immigrants | Armenia | 15.1 /100 | #211 | Poor 1.7% |
| Immigrants | South Eastern Asia | 14.7 /100 | #212 | Poor 1.7% |
| Koreans | 14.2 /100 | #213 | Poor 1.7% |
| Pueblo | 14.2 /100 | #214 | Poor 1.7% |
| Alaskan Athabascans | 13.8 /100 | #215 | Poor 1.7% |
| Immigrants | Burma/Myanmar | 13.5 /100 | #216 | Poor 1.7% |