Paraguayan vs Palestinian 6th Grade

COMPARE

Paraguayan
Race
Ancestry
AfghanAfricanAlaska NativeAlaskan AthabascanAlbanianAleutAlsatianAmericanApacheArabArapahoArgentineanArmenianAssyrian/Chaldean/SyriacAustralianAustrianBahamianBangladeshiBarbadianBasqueBelgianBelizeanBermudanBhutaneseBlackfeetBolivianBrazilianBritishBritish West IndianBulgarianBurmeseCajunCambodianCanadianCape VerdeanCarpatho RusynCelticCentral AmericanCentral American IndianCherokeeCheyenneChickasawChileanChineseChippewaChoctawColombianColvilleComancheCosta RicanCreeCreekCroatianCrowCubanCypriotCzechCzechoslovakianDanishDelawareDominicanDutchDutch West IndianEastern EuropeanEcuadorianEgyptianEnglishEstonianEthiopianEuropeanFijianFilipinoFinnishFrenchFrench American IndianFrench CanadianGermanGerman RussianGhanaianGreekGuamanian/ChamorroGuatemalanGuyaneseHaitianHmongHonduranHopiHoumaHungarianIcelanderIndian (Asian)IndonesianInupiatIranianIraqiIrishIroquoisIsraeliItalianJamaicanJapaneseJordanianKenyanKiowaKoreanLaotianLatvianLebaneseLiberianLithuanianLumbeeLuxembourgerMacedonianMalaysianMalteseMarshalleseMenomineeMexicanMexican American IndianMongolianMoroccanNative HawaiianNavajoNepaleseNew ZealanderNicaraguanNigerianNorthern EuropeanNorwegianOkinawanOsageOttawaPaiutePakistaniPanamanianParaguayanPennsylvania GermanPeruvianPimaPolishPortuguesePotawatomiPuebloPuerto RicanPuget Sound SalishRomanianRussianSalvadoranSamoanScandinavianScotch-IrishScottishSeminoleSenegaleseSerbianShoshoneSierra LeoneanSiouxSlavicSlovakSloveneSomaliSouth AfricanSouth AmericanSouth American IndianSoviet UnionSpaniardSpanishSpanish AmericanSpanish American IndianSri LankanSubsaharan AfricanSudaneseSwedishSwissSyrianTaiwaneseThaiTlingit-HaidaTohono O'OdhamTonganTrinidadian and TobagonianTsimshianTurkishU.S. Virgin IslanderUgandanUkrainianUruguayanUteVenezuelanVietnameseWelshWest IndianYakamaYaquiYugoslavianYumanYup'ikZimbabwean
Immigration
NonimmigrantsImmigrantsAfghanistanAfricaAlbaniaArgentinaArmeniaAsiaAustraliaAustriaBahamasBangladeshBarbadosBelarusBelgiumBelizeBoliviaBosnia and HerzegovinaBrazilBulgariaBurma/MyanmarCabo VerdeCambodiaCameroonCanadaCaribbeanCentral AmericaChileChinaColombiaCongoCosta RicaCroatiaCubaCzechoslovakiaDenmarkDominicaDominican RepublicEastern AfricaEastern AsiaEastern EuropeEcuadorEgyptEl SalvadorEnglandEritreaEthiopiaEuropeFijiFranceGermanyGhanaGreeceGrenadaGuatemalaGuyanaHaitiHondurasHong KongHungaryIndiaIndonesiaIranIraqIrelandIsraelItalyJamaicaJapanJordanKazakhstanKenyaKoreaKuwaitLaosLatin AmericaLatviaLebanonLiberiaLithuaniaMalaysiaMexicoMicronesiaMiddle AfricaMoldovaMoroccoNepalNetherlandsNicaraguaNigeriaNorth AmericaNorth MacedoniaNorthern AfricaNorthern EuropeNorwayOceaniaPakistanPanamaPeruPhilippinesPolandPortugalRomaniaRussiaSaudi ArabiaScotlandSenegalSerbiaSierra LeoneSingaporeSomaliaSouth AfricaSouth AmericaSouth Central AsiaSouth Eastern AsiaSouthern EuropeSpainSri LankaSt. Vincent and the GrenadinesSudanSwedenSwitzerlandSyriaTaiwanThailandTrinidad and TobagoTurkeyUgandaUkraineUruguayUzbekistanVenezuelaVietnamWest IndiesWestern AfricaWestern AsiaWestern EuropeYemenZaireZimbabweAzores
Palestinian
Race
Ancestry
AfghanAfricanAlaska NativeAlaskan AthabascanAlbanianAleutAlsatianAmericanApacheArabArapahoArgentineanArmenianAssyrian/Chaldean/SyriacAustralianAustrianBahamianBangladeshiBarbadianBasqueBelgianBelizeanBermudanBhutaneseBlackfeetBolivianBrazilianBritishBritish West IndianBulgarianBurmeseCajunCambodianCanadianCape VerdeanCarpatho RusynCelticCentral AmericanCentral American IndianCherokeeCheyenneChickasawChileanChineseChippewaChoctawColombianColvilleComancheCosta RicanCreeCreekCroatianCrowCubanCypriotCzechCzechoslovakianDanishDelawareDominicanDutchDutch West IndianEastern EuropeanEcuadorianEgyptianEnglishEstonianEthiopianEuropeanFijianFilipinoFinnishFrenchFrench American IndianFrench CanadianGermanGerman RussianGhanaianGreekGuamanian/ChamorroGuatemalanGuyaneseHaitianHmongHonduranHopiHoumaHungarianIcelanderIndian (Asian)IndonesianInupiatIranianIraqiIrishIroquoisIsraeliItalianJamaicanJapaneseJordanianKenyanKiowaKoreanLaotianLatvianLebaneseLiberianLithuanianLumbeeLuxembourgerMacedonianMalaysianMalteseMarshalleseMenomineeMexicanMexican American IndianMongolianMoroccanNative HawaiianNavajoNepaleseNew ZealanderNicaraguanNigerianNorthern EuropeanNorwegianOkinawanOsageOttawaPaiutePakistaniPalestinianPanamanianPennsylvania GermanPeruvianPimaPolishPortuguesePotawatomiPuebloPuerto RicanPuget Sound SalishRomanianRussianSalvadoranSamoanScandinavianScotch-IrishScottishSeminoleSenegaleseSerbianShoshoneSierra LeoneanSiouxSlavicSlovakSloveneSomaliSouth AfricanSouth AmericanSouth American IndianSoviet UnionSpaniardSpanishSpanish AmericanSpanish American IndianSri LankanSubsaharan AfricanSudaneseSwedishSwissSyrianTaiwaneseThaiTlingit-HaidaTohono O'OdhamTonganTrinidadian and TobagonianTsimshianTurkishU.S. Virgin IslanderUgandanUkrainianUruguayanUteVenezuelanVietnameseWelshWest IndianYakamaYaquiYugoslavianYumanYup'ikZimbabwean
Immigration
NonimmigrantsImmigrantsAfghanistanAfricaAlbaniaArgentinaArmeniaAsiaAustraliaAustriaBahamasBangladeshBarbadosBelarusBelgiumBelizeBoliviaBosnia and HerzegovinaBrazilBulgariaBurma/MyanmarCabo VerdeCambodiaCameroonCanadaCaribbeanCentral AmericaChileChinaColombiaCongoCosta RicaCroatiaCubaCzechoslovakiaDenmarkDominicaDominican RepublicEastern AfricaEastern AsiaEastern EuropeEcuadorEgyptEl SalvadorEnglandEritreaEthiopiaEuropeFijiFranceGermanyGhanaGreeceGrenadaGuatemalaGuyanaHaitiHondurasHong KongHungaryIndiaIndonesiaIranIraqIrelandIsraelItalyJamaicaJapanJordanKazakhstanKenyaKoreaKuwaitLaosLatin AmericaLatviaLebanonLiberiaLithuaniaMalaysiaMexicoMicronesiaMiddle AfricaMoldovaMoroccoNepalNetherlandsNicaraguaNigeriaNorth AmericaNorth MacedoniaNorthern AfricaNorthern EuropeNorwayOceaniaPakistanPanamaPeruPhilippinesPolandPortugalRomaniaRussiaSaudi ArabiaScotlandSenegalSerbiaSierra LeoneSingaporeSomaliaSouth AfricaSouth AmericaSouth Central AsiaSouth Eastern AsiaSouthern EuropeSpainSri LankaSt. Vincent and the GrenadinesSudanSwedenSwitzerlandSyriaTaiwanThailandTrinidad and TobagoTurkeyUgandaUkraineUruguayUzbekistanVenezuelaVietnamWest IndiesWestern AfricaWestern AsiaWestern EuropeYemenZaireZimbabweAzores
6th Grade
Income
Poverty
Unemployment
Labor Participation
Family Structure
Vehicle Availability
Education Level
Disability

6th Grade Comparison

Paraguayans

Palestinians

Fair
Exceptional
96.9%
6TH GRADE
26.6/ 100
METRIC RATING
193rd/ 347
METRIC RANK
97.3%
6TH GRADE
90.9/ 100
METRIC RATING
132nd/ 347
METRIC RANK

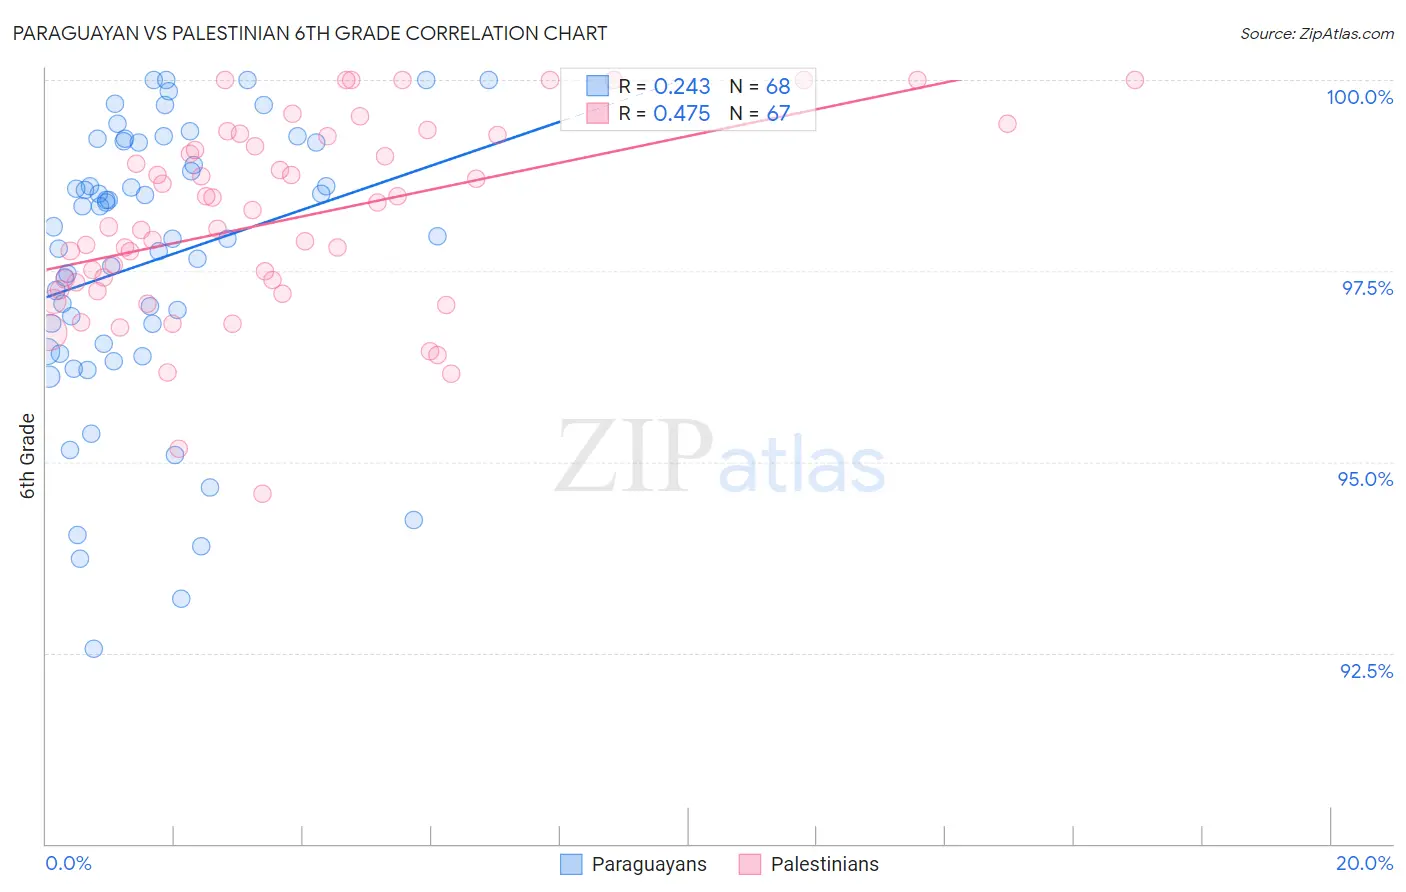
Paraguayan vs Palestinian 6th Grade Correlation Chart

The statistical analysis conducted on geographies consisting of 95,115,093 people shows a weak positive correlation between the proportion of Paraguayans and percentage of population with at least 6th grade education in the United States with a correlation coefficient (R) of 0.243 and weighted average of 96.9%. Similarly, the statistical analysis conducted on geographies consisting of 216,424,519 people shows a moderate positive correlation between the proportion of Palestinians and percentage of population with at least 6th grade education in the United States with a correlation coefficient (R) of 0.475 and weighted average of 97.3%, a difference of 0.38%.
Paraguayan vs Palestinian 6th Grade

6th Grade Correlation Summary

MeasurementParaguayanPalestinian
Minimum92.6%94.6%
Maximum100.0%100.0%
Range7.4%5.4%
Mean97.6%98.2%
Median98.0%98.1%
Interquartile 25% (IQ1)96.5%97.3%
Interquartile 75% (IQ3)99.2%99.3%
Interquartile Range (IQR)2.7%2.0%
Standard Deviation (Sample)1.8%1.3%
Standard Deviation (Population)1.8%1.2%

Similar Demographics by 6th Grade

Demographics Similar to Paraguayans by 6th Grade

In terms of 6th grade, the demographic groups most similar to Paraguayans are Panamanian (96.9%, a difference of 0.0%), Hawaiian (96.9%, a difference of 0.0%), Dutch West Indian (96.9%, a difference of 0.010%), Immigrants from Lebanon (96.9%, a difference of 0.010%), and Immigrants from Brazil (96.9%, a difference of 0.010%).
DemographicsRating | Rank6th Grade
Immigrants | Egypt
31.4
/100
|
#186
Fair
97.0%
Guamanians/Chamorros
30.6
/100
|
#187
Fair
97.0%
Immigrants | Argentina
30.4
/100
|
#188
Fair
97.0%
Blacks/African Americans
30.2
/100
|
#189
Fair
97.0%
Dutch West Indians
28.3
/100
|
#190
Fair
96.9%
Panamanians
27.3
/100
|
#191
Fair
96.9%
Hawaiians
27.0
/100
|
#192
Fair
96.9%
Paraguayans
26.6
/100
|
#193
Fair
96.9%
Immigrants | Lebanon
25.6
/100
|
#194
Fair
96.9%
Immigrants | Brazil
25.5
/100
|
#195
Fair
96.9%
Immigrants | Uganda
21.2
/100
|
#196
Fair
96.9%
Brazilians
20.1
/100
|
#197
Fair
96.9%
Immigrants | Albania
18.8
/100
|
#198
Poor
96.9%
Immigrants | Northern Africa
15.7
/100
|
#199
Poor
96.9%
Africans
14.8
/100
|
#200
Poor
96.9%

Demographics Similar to Palestinians by 6th Grade

In terms of 6th grade, the demographic groups most similar to Palestinians are Immigrants from Europe (97.3%, a difference of 0.0%), Immigrants from Serbia (97.3%, a difference of 0.010%), Cambodian (97.3%, a difference of 0.010%), Immigrants from Moldova (97.3%, a difference of 0.010%), and Immigrants from Romania (97.3%, a difference of 0.020%).
DemographicsRating | Rank6th Grade
Spanish
93.7
/100
|
#125
Exceptional
97.3%
Immigrants | Bulgaria
93.6
/100
|
#126
Exceptional
97.3%
Immigrants | Croatia
93.1
/100
|
#127
Exceptional
97.3%
Immigrants | Romania
92.0
/100
|
#128
Exceptional
97.3%
Immigrants | Serbia
91.9
/100
|
#129
Exceptional
97.3%
Cambodians
91.8
/100
|
#130
Exceptional
97.3%
Immigrants | Europe
91.1
/100
|
#131
Exceptional
97.3%
Palestinians
90.9
/100
|
#132
Exceptional
97.3%
Immigrants | Moldova
90.0
/100
|
#133
Excellent
97.3%
Immigrants | Kuwait
89.5
/100
|
#134
Excellent
97.3%
Immigrants | Hungary
89.5
/100
|
#135
Excellent
97.3%
Filipinos
88.9
/100
|
#136
Excellent
97.3%
Burmese
87.8
/100
|
#137
Excellent
97.3%
Blackfeet
87.7
/100
|
#138
Excellent
97.3%
Immigrants | Turkey
86.1
/100
|
#139
Excellent
97.3%