Immigrants from Zaire vs Palestinian 6th Grade
COMPARE
Immigrants from Zaire
Palestinian
6th Grade
6th Grade Comparison
Immigrants from Zaire
Palestinians
96.9%
6TH GRADE
14.5/ 100
METRIC RATING
201st/ 347
METRIC RANK
97.3%
6TH GRADE
90.9/ 100
METRIC RATING
132nd/ 347
METRIC RANK
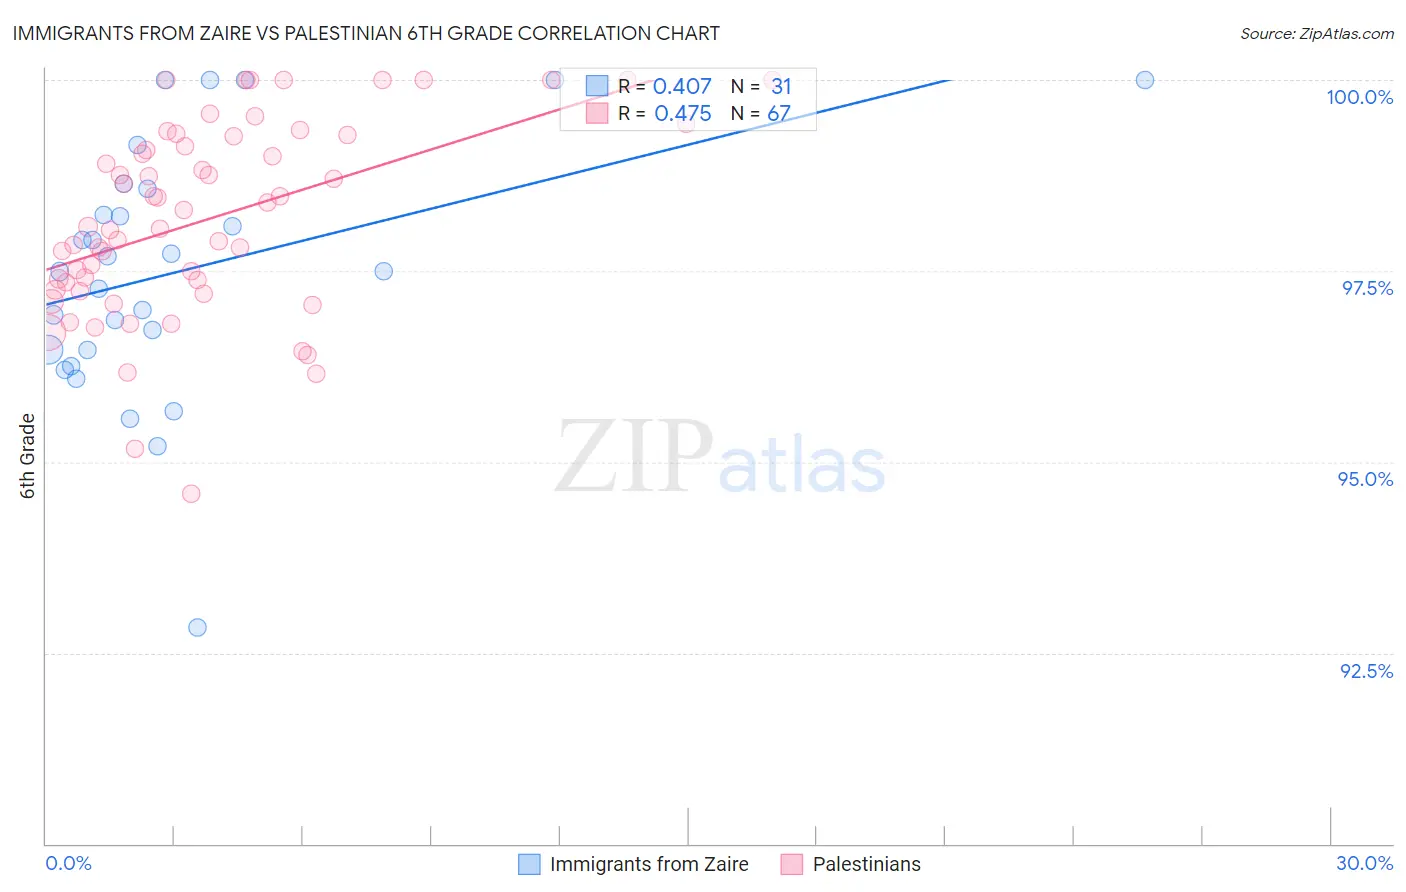
Immigrants from Zaire vs Palestinian 6th Grade Correlation Chart
The statistical analysis conducted on geographies consisting of 107,212,695 people shows a moderate positive correlation between the proportion of Immigrants from Zaire and percentage of population with at least 6th grade education in the United States with a correlation coefficient (R) of 0.407 and weighted average of 96.9%. Similarly, the statistical analysis conducted on geographies consisting of 216,424,519 people shows a moderate positive correlation between the proportion of Palestinians and percentage of population with at least 6th grade education in the United States with a correlation coefficient (R) of 0.475 and weighted average of 97.3%, a difference of 0.47%.
6th Grade Correlation Summary
| Measurement | Immigrants from Zaire | Palestinian |
| Minimum | 92.8% | 94.6% |
| Maximum | 100.0% | 100.0% |
| Range | 7.2% | 5.4% |
| Mean | 97.5% | 98.2% |
| Median | 97.5% | 98.1% |
| Interquartile 25% (IQ1) | 96.5% | 97.3% |
| Interquartile 75% (IQ3) | 98.6% | 99.3% |
| Interquartile Range (IQR) | 2.1% | 2.0% |
| Standard Deviation (Sample) | 1.6% | 1.3% |
| Standard Deviation (Population) | 1.6% | 1.2% |
Similar Demographics by 6th Grade
Demographics Similar to Immigrants from Zaire by 6th Grade
In terms of 6th grade, the demographic groups most similar to Immigrants from Zaire are African (96.9%, a difference of 0.0%), Immigrants from Chile (96.8%, a difference of 0.0%), Immigrants from Northern Africa (96.9%, a difference of 0.010%), Sudanese (96.8%, a difference of 0.010%), and Immigrants from Bahamas (96.8%, a difference of 0.010%).
| Demographics | Rating | Rank | 6th Grade |
| Immigrants | Lebanon | 25.6 /100 | #194 | Fair 96.9% |
| Immigrants | Brazil | 25.5 /100 | #195 | Fair 96.9% |
| Immigrants | Uganda | 21.2 /100 | #196 | Fair 96.9% |
| Brazilians | 20.1 /100 | #197 | Fair 96.9% |
| Immigrants | Albania | 18.8 /100 | #198 | Poor 96.9% |
| Immigrants | Northern Africa | 15.7 /100 | #199 | Poor 96.9% |
| Africans | 14.8 /100 | #200 | Poor 96.9% |
| Immigrants | Zaire | 14.5 /100 | #201 | Poor 96.9% |
| Immigrants | Chile | 14.2 /100 | #202 | Poor 96.8% |
| Sudanese | 13.9 /100 | #203 | Poor 96.8% |
| Immigrants | Bahamas | 13.8 /100 | #204 | Poor 96.8% |
| Natives/Alaskans | 13.0 /100 | #205 | Poor 96.8% |
| Laotians | 11.8 /100 | #206 | Poor 96.8% |
| Iraqis | 11.7 /100 | #207 | Poor 96.8% |
| Samoans | 11.0 /100 | #208 | Poor 96.8% |
Demographics Similar to Palestinians by 6th Grade
In terms of 6th grade, the demographic groups most similar to Palestinians are Immigrants from Europe (97.3%, a difference of 0.0%), Immigrants from Serbia (97.3%, a difference of 0.010%), Cambodian (97.3%, a difference of 0.010%), Immigrants from Moldova (97.3%, a difference of 0.010%), and Immigrants from Romania (97.3%, a difference of 0.020%).
| Demographics | Rating | Rank | 6th Grade |
| Spanish | 93.7 /100 | #125 | Exceptional 97.3% |
| Immigrants | Bulgaria | 93.6 /100 | #126 | Exceptional 97.3% |
| Immigrants | Croatia | 93.1 /100 | #127 | Exceptional 97.3% |
| Immigrants | Romania | 92.0 /100 | #128 | Exceptional 97.3% |
| Immigrants | Serbia | 91.9 /100 | #129 | Exceptional 97.3% |
| Cambodians | 91.8 /100 | #130 | Exceptional 97.3% |
| Immigrants | Europe | 91.1 /100 | #131 | Exceptional 97.3% |
| Palestinians | 90.9 /100 | #132 | Exceptional 97.3% |
| Immigrants | Moldova | 90.0 /100 | #133 | Excellent 97.3% |
| Immigrants | Kuwait | 89.5 /100 | #134 | Excellent 97.3% |
| Immigrants | Hungary | 89.5 /100 | #135 | Excellent 97.3% |
| Filipinos | 88.9 /100 | #136 | Excellent 97.3% |
| Burmese | 87.8 /100 | #137 | Excellent 97.3% |
| Blackfeet | 87.7 /100 | #138 | Excellent 97.3% |
| Immigrants | Turkey | 86.1 /100 | #139 | Excellent 97.3% |