Arab vs Palestinian 6th Grade
COMPARE
Arab
Palestinian
6th Grade
6th Grade Comparison
Arabs
Palestinians
97.0%
6TH GRADE
50.1/ 100
METRIC RATING
173rd/ 347
METRIC RANK
97.3%
6TH GRADE
90.9/ 100
METRIC RATING
132nd/ 347
METRIC RANK
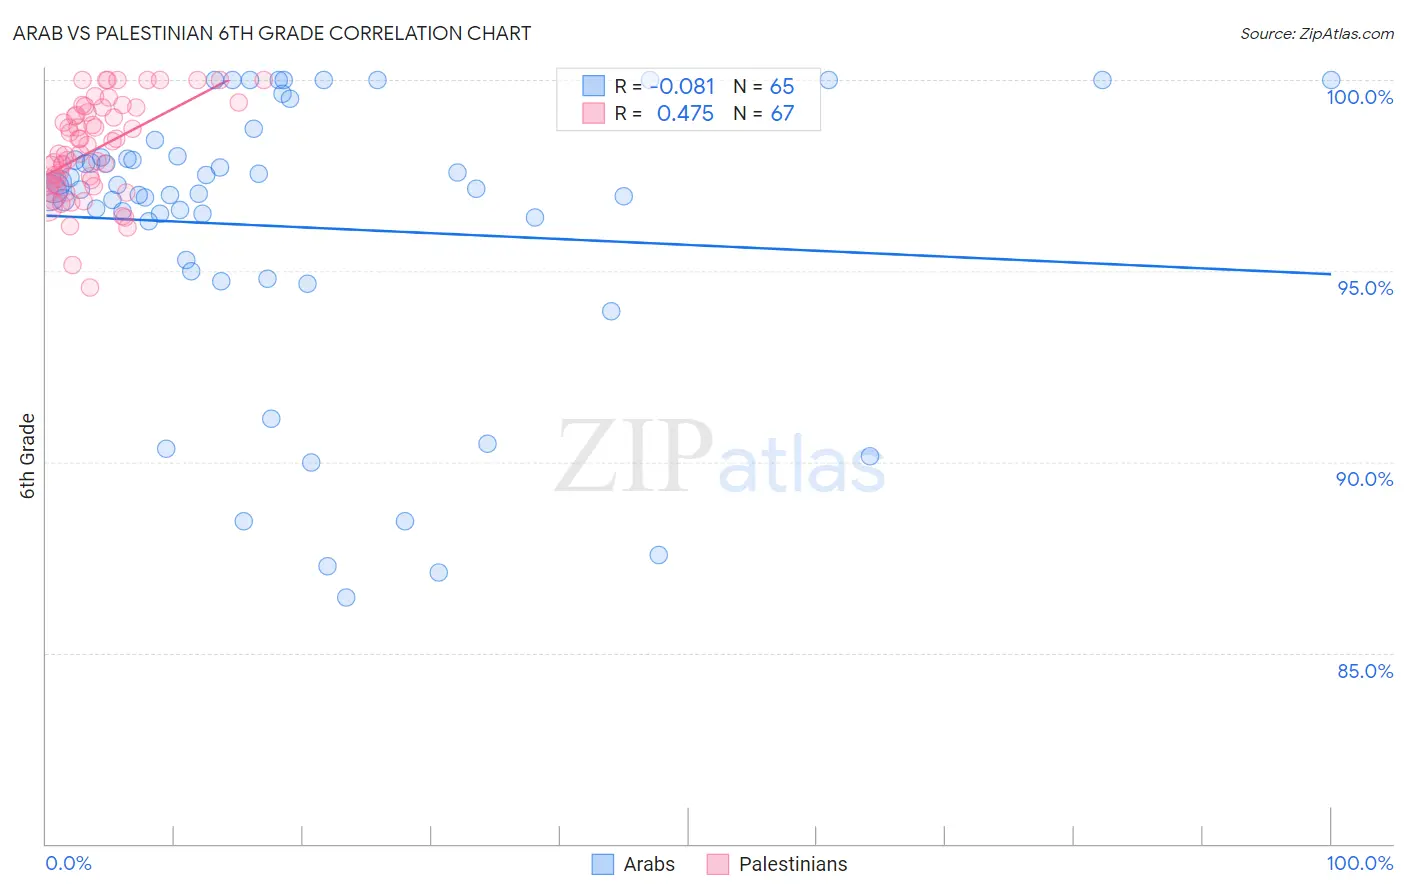
Arab vs Palestinian 6th Grade Correlation Chart
The statistical analysis conducted on geographies consisting of 486,871,007 people shows a slight negative correlation between the proportion of Arabs and percentage of population with at least 6th grade education in the United States with a correlation coefficient (R) of -0.081 and weighted average of 97.0%. Similarly, the statistical analysis conducted on geographies consisting of 216,424,519 people shows a moderate positive correlation between the proportion of Palestinians and percentage of population with at least 6th grade education in the United States with a correlation coefficient (R) of 0.475 and weighted average of 97.3%, a difference of 0.26%.
6th Grade Correlation Summary
| Measurement | Arab | Palestinian |
| Minimum | 86.5% | 94.6% |
| Maximum | 100.0% | 100.0% |
| Range | 13.5% | 5.4% |
| Mean | 96.2% | 98.2% |
| Median | 97.1% | 98.1% |
| Interquartile 25% (IQ1) | 95.1% | 97.3% |
| Interquartile 75% (IQ3) | 98.0% | 99.3% |
| Interquartile Range (IQR) | 2.8% | 2.0% |
| Standard Deviation (Sample) | 3.7% | 1.3% |
| Standard Deviation (Population) | 3.7% | 1.2% |
Similar Demographics by 6th Grade
Demographics Similar to Arabs by 6th Grade
In terms of 6th grade, the demographic groups most similar to Arabs are Egyptian (97.1%, a difference of 0.0%), Venezuelan (97.0%, a difference of 0.0%), Bermudan (97.1%, a difference of 0.010%), Chilean (97.1%, a difference of 0.010%), and Immigrants from Sri Lanka (97.1%, a difference of 0.010%).
| Demographics | Rating | Rank | 6th Grade |
| Immigrants | Italy | 53.8 /100 | #166 | Average 97.1% |
| Apache | 53.6 /100 | #167 | Average 97.1% |
| Immigrants | Taiwan | 53.5 /100 | #168 | Average 97.1% |
| Bermudans | 52.6 /100 | #169 | Average 97.1% |
| Chileans | 52.1 /100 | #170 | Average 97.1% |
| Immigrants | Sri Lanka | 51.7 /100 | #171 | Average 97.1% |
| Egyptians | 50.9 /100 | #172 | Average 97.1% |
| Arabs | 50.1 /100 | #173 | Average 97.0% |
| Venezuelans | 50.0 /100 | #174 | Average 97.0% |
| Immigrants | Kazakhstan | 47.3 /100 | #175 | Average 97.0% |
| Immigrants | Micronesia | 47.1 /100 | #176 | Average 97.0% |
| Mongolians | 46.7 /100 | #177 | Average 97.0% |
| Pakistanis | 46.0 /100 | #178 | Average 97.0% |
| Immigrants | Kenya | 45.3 /100 | #179 | Average 97.0% |
| Immigrants | Spain | 39.9 /100 | #180 | Fair 97.0% |
Demographics Similar to Palestinians by 6th Grade
In terms of 6th grade, the demographic groups most similar to Palestinians are Immigrants from Europe (97.3%, a difference of 0.0%), Immigrants from Serbia (97.3%, a difference of 0.010%), Cambodian (97.3%, a difference of 0.010%), Immigrants from Moldova (97.3%, a difference of 0.010%), and Immigrants from Romania (97.3%, a difference of 0.020%).
| Demographics | Rating | Rank | 6th Grade |
| Spanish | 93.7 /100 | #125 | Exceptional 97.3% |
| Immigrants | Bulgaria | 93.6 /100 | #126 | Exceptional 97.3% |
| Immigrants | Croatia | 93.1 /100 | #127 | Exceptional 97.3% |
| Immigrants | Romania | 92.0 /100 | #128 | Exceptional 97.3% |
| Immigrants | Serbia | 91.9 /100 | #129 | Exceptional 97.3% |
| Cambodians | 91.8 /100 | #130 | Exceptional 97.3% |
| Immigrants | Europe | 91.1 /100 | #131 | Exceptional 97.3% |
| Palestinians | 90.9 /100 | #132 | Exceptional 97.3% |
| Immigrants | Moldova | 90.0 /100 | #133 | Excellent 97.3% |
| Immigrants | Kuwait | 89.5 /100 | #134 | Excellent 97.3% |
| Immigrants | Hungary | 89.5 /100 | #135 | Excellent 97.3% |
| Filipinos | 88.9 /100 | #136 | Excellent 97.3% |
| Burmese | 87.8 /100 | #137 | Excellent 97.3% |
| Blackfeet | 87.7 /100 | #138 | Excellent 97.3% |
| Immigrants | Turkey | 86.1 /100 | #139 | Excellent 97.3% |