Immigrants from Guatemala vs Palestinian 6th Grade
COMPARE
Immigrants from Guatemala
Palestinian
6th Grade
6th Grade Comparison
Immigrants from Guatemala
Palestinians
93.9%
6TH GRADE
0.0/ 100
METRIC RATING
344th/ 347
METRIC RANK
97.3%
6TH GRADE
90.9/ 100
METRIC RATING
132nd/ 347
METRIC RANK
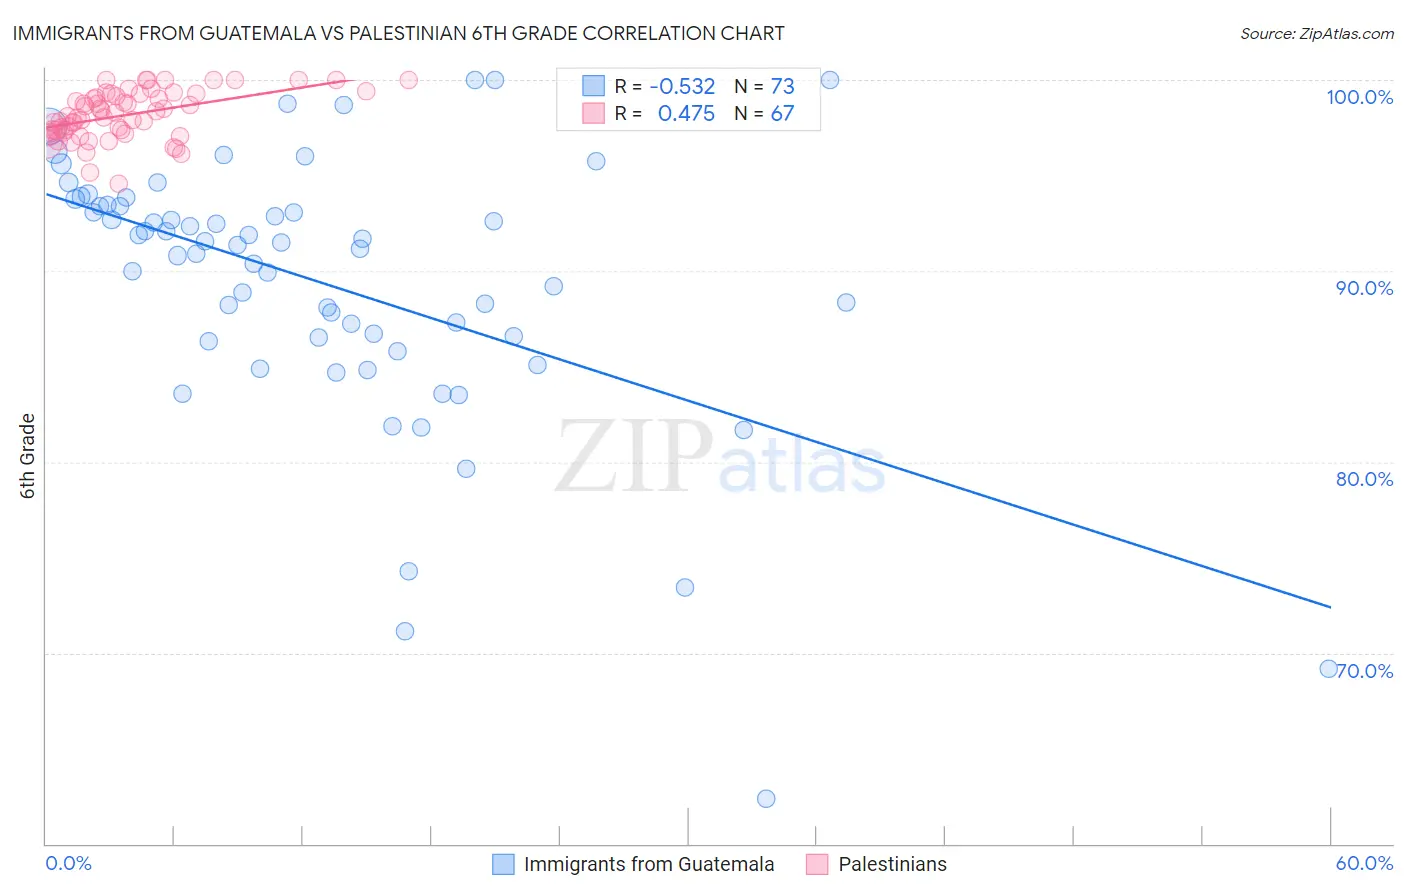
Immigrants from Guatemala vs Palestinian 6th Grade Correlation Chart
The statistical analysis conducted on geographies consisting of 377,285,993 people shows a substantial negative correlation between the proportion of Immigrants from Guatemala and percentage of population with at least 6th grade education in the United States with a correlation coefficient (R) of -0.532 and weighted average of 93.9%. Similarly, the statistical analysis conducted on geographies consisting of 216,424,519 people shows a moderate positive correlation between the proportion of Palestinians and percentage of population with at least 6th grade education in the United States with a correlation coefficient (R) of 0.475 and weighted average of 97.3%, a difference of 3.6%.
6th Grade Correlation Summary
| Measurement | Immigrants from Guatemala | Palestinian |
| Minimum | 62.4% | 94.6% |
| Maximum | 100.0% | 100.0% |
| Range | 37.6% | 5.4% |
| Mean | 89.3% | 98.2% |
| Median | 91.4% | 98.1% |
| Interquartile 25% (IQ1) | 86.4% | 97.3% |
| Interquartile 75% (IQ3) | 93.4% | 99.3% |
| Interquartile Range (IQR) | 7.0% | 2.0% |
| Standard Deviation (Sample) | 7.1% | 1.3% |
| Standard Deviation (Population) | 7.0% | 1.2% |
Similar Demographics by 6th Grade
Demographics Similar to Immigrants from Guatemala by 6th Grade
In terms of 6th grade, the demographic groups most similar to Immigrants from Guatemala are Immigrants from Mexico (93.9%, a difference of 0.0%), Salvadoran (93.9%, a difference of 0.0%), Immigrants from Central America (94.0%, a difference of 0.060%), Immigrants from Yemen (94.1%, a difference of 0.17%), and Guatemalan (94.2%, a difference of 0.28%).
| Demographics | Rating | Rank | 6th Grade |
| Immigrants | Latin America | 0.0 /100 | #333 | Tragic 94.7% |
| Immigrants | Azores | 0.0 /100 | #334 | Tragic 94.7% |
| Mexicans | 0.0 /100 | #335 | Tragic 94.6% |
| Immigrants | Dominican Republic | 0.0 /100 | #336 | Tragic 94.6% |
| Central Americans | 0.0 /100 | #337 | Tragic 94.5% |
| Immigrants | Cabo Verde | 0.0 /100 | #338 | Tragic 94.4% |
| Yakama | 0.0 /100 | #339 | Tragic 94.3% |
| Guatemalans | 0.0 /100 | #340 | Tragic 94.2% |
| Immigrants | Yemen | 0.0 /100 | #341 | Tragic 94.1% |
| Immigrants | Central America | 0.0 /100 | #342 | Tragic 94.0% |
| Immigrants | Mexico | 0.0 /100 | #343 | Tragic 93.9% |
| Immigrants | Guatemala | 0.0 /100 | #344 | Tragic 93.9% |
| Salvadorans | 0.0 /100 | #345 | Tragic 93.9% |
| Spanish American Indians | 0.0 /100 | #346 | Tragic 93.6% |
| Immigrants | El Salvador | 0.0 /100 | #347 | Tragic 93.6% |
Demographics Similar to Palestinians by 6th Grade
In terms of 6th grade, the demographic groups most similar to Palestinians are Immigrants from Europe (97.3%, a difference of 0.0%), Immigrants from Serbia (97.3%, a difference of 0.010%), Cambodian (97.3%, a difference of 0.010%), Immigrants from Moldova (97.3%, a difference of 0.010%), and Immigrants from Romania (97.3%, a difference of 0.020%).
| Demographics | Rating | Rank | 6th Grade |
| Spanish | 93.7 /100 | #125 | Exceptional 97.3% |
| Immigrants | Bulgaria | 93.6 /100 | #126 | Exceptional 97.3% |
| Immigrants | Croatia | 93.1 /100 | #127 | Exceptional 97.3% |
| Immigrants | Romania | 92.0 /100 | #128 | Exceptional 97.3% |
| Immigrants | Serbia | 91.9 /100 | #129 | Exceptional 97.3% |
| Cambodians | 91.8 /100 | #130 | Exceptional 97.3% |
| Immigrants | Europe | 91.1 /100 | #131 | Exceptional 97.3% |
| Palestinians | 90.9 /100 | #132 | Exceptional 97.3% |
| Immigrants | Moldova | 90.0 /100 | #133 | Excellent 97.3% |
| Immigrants | Kuwait | 89.5 /100 | #134 | Excellent 97.3% |
| Immigrants | Hungary | 89.5 /100 | #135 | Excellent 97.3% |
| Filipinos | 88.9 /100 | #136 | Excellent 97.3% |
| Burmese | 87.8 /100 | #137 | Excellent 97.3% |
| Blackfeet | 87.7 /100 | #138 | Excellent 97.3% |
| Immigrants | Turkey | 86.1 /100 | #139 | Excellent 97.3% |