Paraguayan vs Immigrants from Thailand 6th Grade
COMPARE
Paraguayan
Immigrants from Thailand
6th Grade
6th Grade Comparison
Paraguayans
Immigrants from Thailand
96.9%
6TH GRADE
26.6/ 100
METRIC RATING
193rd/ 347
METRIC RANK
96.3%
6TH GRADE
0.1/ 100
METRIC RATING
278th/ 347
METRIC RANK
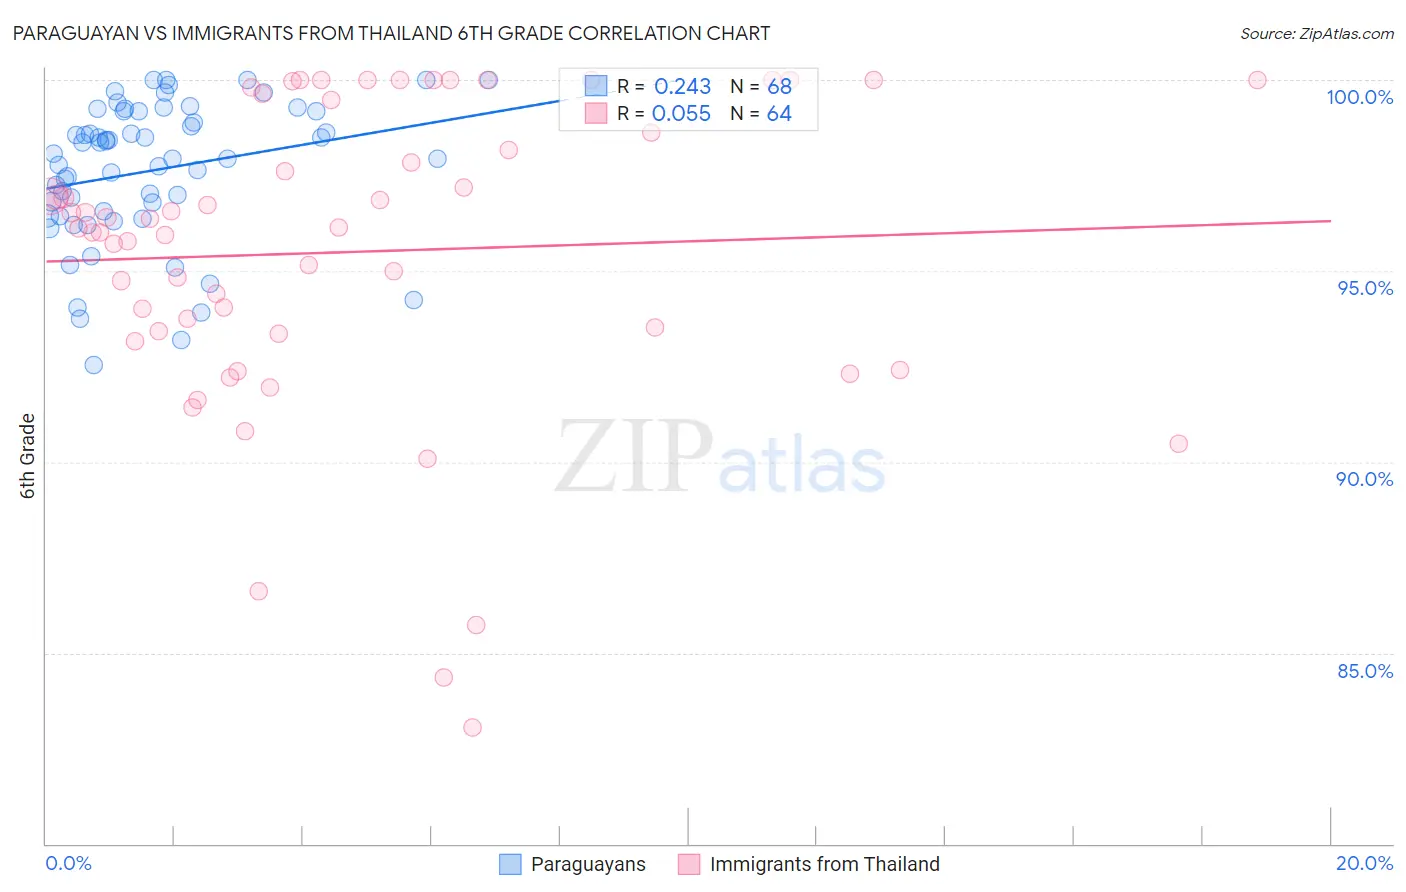
Paraguayan vs Immigrants from Thailand 6th Grade Correlation Chart
The statistical analysis conducted on geographies consisting of 95,115,093 people shows a weak positive correlation between the proportion of Paraguayans and percentage of population with at least 6th grade education in the United States with a correlation coefficient (R) of 0.243 and weighted average of 96.9%. Similarly, the statistical analysis conducted on geographies consisting of 317,022,916 people shows a slight positive correlation between the proportion of Immigrants from Thailand and percentage of population with at least 6th grade education in the United States with a correlation coefficient (R) of 0.055 and weighted average of 96.3%, a difference of 0.70%.
6th Grade Correlation Summary
| Measurement | Paraguayan | Immigrants from Thailand |
| Minimum | 92.6% | 83.0% |
| Maximum | 100.0% | 100.0% |
| Range | 7.4% | 17.0% |
| Mean | 97.6% | 95.5% |
| Median | 98.0% | 96.1% |
| Interquartile 25% (IQ1) | 96.5% | 93.4% |
| Interquartile 75% (IQ3) | 99.2% | 99.0% |
| Interquartile Range (IQR) | 2.7% | 5.7% |
| Standard Deviation (Sample) | 1.8% | 4.0% |
| Standard Deviation (Population) | 1.8% | 4.0% |
Similar Demographics by 6th Grade
Demographics Similar to Paraguayans by 6th Grade
In terms of 6th grade, the demographic groups most similar to Paraguayans are Panamanian (96.9%, a difference of 0.0%), Hawaiian (96.9%, a difference of 0.0%), Dutch West Indian (96.9%, a difference of 0.010%), Immigrants from Lebanon (96.9%, a difference of 0.010%), and Immigrants from Brazil (96.9%, a difference of 0.010%).
| Demographics | Rating | Rank | 6th Grade |
| Immigrants | Egypt | 31.4 /100 | #186 | Fair 97.0% |
| Guamanians/Chamorros | 30.6 /100 | #187 | Fair 97.0% |
| Immigrants | Argentina | 30.4 /100 | #188 | Fair 97.0% |
| Blacks/African Americans | 30.2 /100 | #189 | Fair 97.0% |
| Dutch West Indians | 28.3 /100 | #190 | Fair 96.9% |
| Panamanians | 27.3 /100 | #191 | Fair 96.9% |
| Hawaiians | 27.0 /100 | #192 | Fair 96.9% |
| Paraguayans | 26.6 /100 | #193 | Fair 96.9% |
| Immigrants | Lebanon | 25.6 /100 | #194 | Fair 96.9% |
| Immigrants | Brazil | 25.5 /100 | #195 | Fair 96.9% |
| Immigrants | Uganda | 21.2 /100 | #196 | Fair 96.9% |
| Brazilians | 20.1 /100 | #197 | Fair 96.9% |
| Immigrants | Albania | 18.8 /100 | #198 | Poor 96.9% |
| Immigrants | Northern Africa | 15.7 /100 | #199 | Poor 96.9% |
| Africans | 14.8 /100 | #200 | Poor 96.9% |
Demographics Similar to Immigrants from Thailand by 6th Grade
In terms of 6th grade, the demographic groups most similar to Immigrants from Thailand are Immigrants from Western Africa (96.3%, a difference of 0.0%), Yaqui (96.3%, a difference of 0.010%), Immigrants from Peru (96.2%, a difference of 0.010%), Immigrants from Ghana (96.3%, a difference of 0.020%), and Immigrants from Afghanistan (96.2%, a difference of 0.020%).
| Demographics | Rating | Rank | 6th Grade |
| Immigrants | Hong Kong | 0.2 /100 | #271 | Tragic 96.3% |
| Immigrants | Bolivia | 0.1 /100 | #272 | Tragic 96.3% |
| Immigrants | Cameroon | 0.1 /100 | #273 | Tragic 96.3% |
| Immigrants | Philippines | 0.1 /100 | #274 | Tragic 96.3% |
| Immigrants | Ghana | 0.1 /100 | #275 | Tragic 96.3% |
| Yaqui | 0.1 /100 | #276 | Tragic 96.3% |
| Immigrants | Western Africa | 0.1 /100 | #277 | Tragic 96.3% |
| Immigrants | Thailand | 0.1 /100 | #278 | Tragic 96.3% |
| Immigrants | Peru | 0.1 /100 | #279 | Tragic 96.2% |
| Immigrants | Afghanistan | 0.1 /100 | #280 | Tragic 96.2% |
| Trinidadians and Tobagonians | 0.1 /100 | #281 | Tragic 96.2% |
| Houma | 0.1 /100 | #282 | Tragic 96.2% |
| Cubans | 0.1 /100 | #283 | Tragic 96.2% |
| Fijians | 0.1 /100 | #284 | Tragic 96.2% |
| Somalis | 0.1 /100 | #285 | Tragic 96.2% |