Paraguayan vs Danish 12th Grade, No Diploma
COMPARE
Paraguayan
Danish
12th Grade, No Diploma
12th Grade, No Diploma Comparison
Paraguayans
Danes
91.5%
12TH GRADE, NO DIPLOMA
78.9/ 100
METRIC RATING
150th/ 347
METRIC RANK
93.5%
12TH GRADE, NO DIPLOMA
100.0/ 100
METRIC RATING
13th/ 347
METRIC RANK
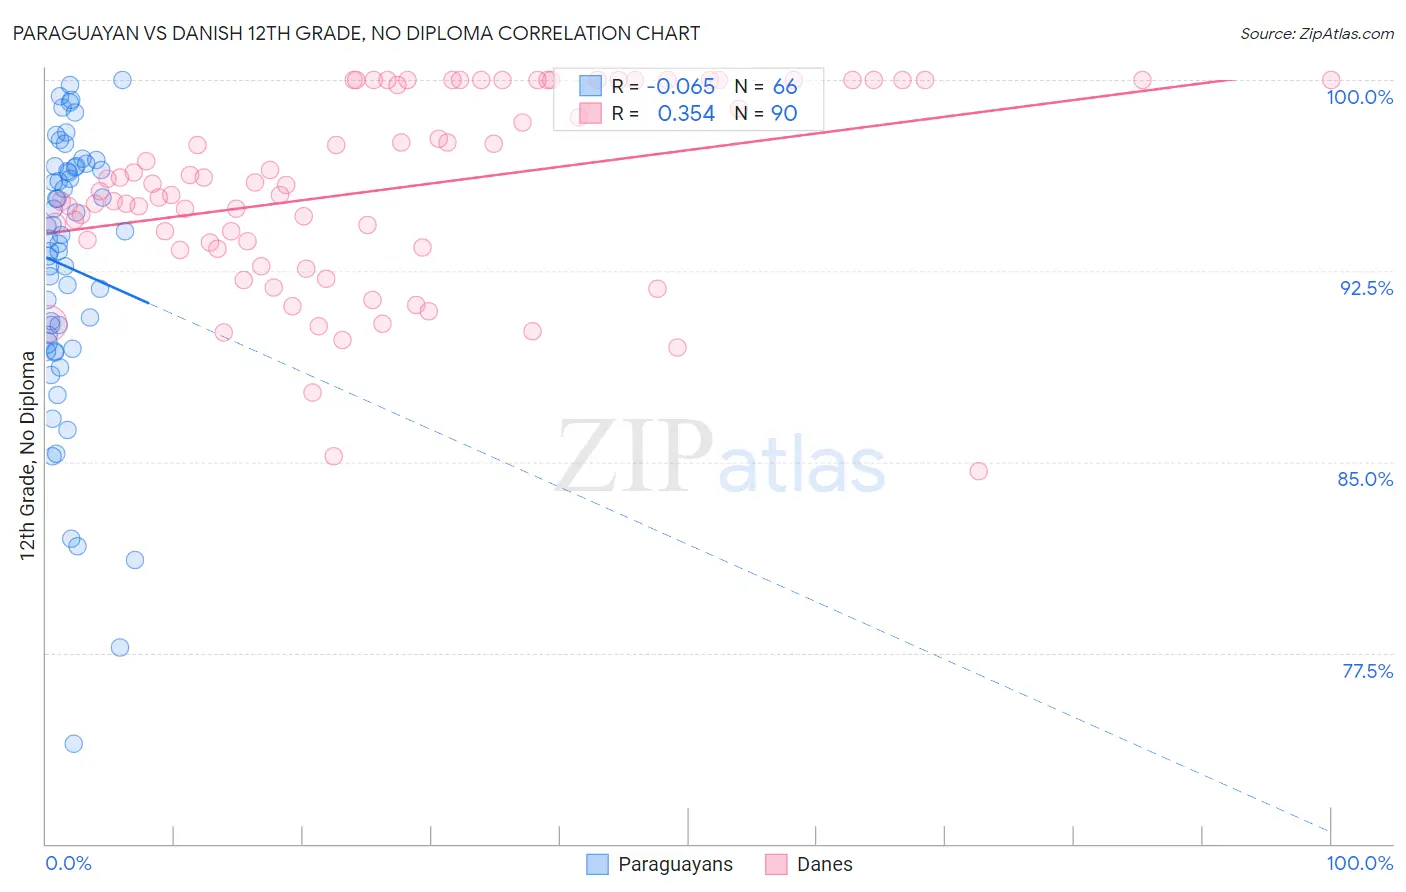
Paraguayan vs Danish 12th Grade, No Diploma Correlation Chart
The statistical analysis conducted on geographies consisting of 95,114,201 people shows a slight negative correlation between the proportion of Paraguayans and percentage of population with at least 12th grade (no diploma) education in the United States with a correlation coefficient (R) of -0.065 and weighted average of 91.5%. Similarly, the statistical analysis conducted on geographies consisting of 474,193,674 people shows a mild positive correlation between the proportion of Danes and percentage of population with at least 12th grade (no diploma) education in the United States with a correlation coefficient (R) of 0.354 and weighted average of 93.5%, a difference of 2.1%.
12th Grade, No Diploma Correlation Summary
| Measurement | Paraguayan | Danish |
| Minimum | 73.9% | 84.6% |
| Maximum | 100.0% | 100.0% |
| Range | 26.1% | 15.4% |
| Mean | 92.7% | 95.7% |
| Median | 93.8% | 95.7% |
| Interquartile 25% (IQ1) | 89.7% | 93.4% |
| Interquartile 75% (IQ3) | 96.6% | 100.0% |
| Interquartile Range (IQR) | 6.9% | 6.6% |
| Standard Deviation (Sample) | 5.4% | 3.7% |
| Standard Deviation (Population) | 5.4% | 3.7% |
Similar Demographics by 12th Grade, No Diploma
Demographics Similar to Paraguayans by 12th Grade, No Diploma
In terms of 12th grade, no diploma, the demographic groups most similar to Paraguayans are Ugandan (91.5%, a difference of 0.0%), Chippewa (91.5%, a difference of 0.0%), Pakistani (91.5%, a difference of 0.010%), Indian (Asian) (91.5%, a difference of 0.010%), and Immigrants from Spain (91.6%, a difference of 0.020%).
| Demographics | Rating | Rank | 12th Grade, No Diploma |
| Immigrants | Argentina | 80.7 /100 | #143 | Excellent 91.6% |
| Immigrants | Spain | 80.1 /100 | #144 | Excellent 91.6% |
| Immigrants | Lebanon | 80.0 /100 | #145 | Excellent 91.6% |
| Immigrants | Brazil | 79.8 /100 | #146 | Good 91.5% |
| Pakistanis | 79.6 /100 | #147 | Good 91.5% |
| Indians (Asian) | 79.4 /100 | #148 | Good 91.5% |
| Ugandans | 79.0 /100 | #149 | Good 91.5% |
| Paraguayans | 78.9 /100 | #150 | Good 91.5% |
| Chippewa | 78.8 /100 | #151 | Good 91.5% |
| Kenyans | 77.4 /100 | #152 | Good 91.5% |
| Iraqis | 75.3 /100 | #153 | Good 91.5% |
| Immigrants | Kenya | 73.9 /100 | #154 | Good 91.5% |
| Immigrants | Iraq | 73.0 /100 | #155 | Good 91.4% |
| Asians | 71.9 /100 | #156 | Good 91.4% |
| Immigrants | Pakistan | 70.7 /100 | #157 | Good 91.4% |
Demographics Similar to Danes by 12th Grade, No Diploma
In terms of 12th grade, no diploma, the demographic groups most similar to Danes are Eastern European (93.5%, a difference of 0.020%), Bulgarian (93.5%, a difference of 0.020%), Polish (93.5%, a difference of 0.030%), Croatian (93.5%, a difference of 0.090%), and Latvian (93.6%, a difference of 0.11%).
| Demographics | Rating | Rank | 12th Grade, No Diploma |
| Immigrants | India | 100.0 /100 | #6 | Exceptional 93.6% |
| Slovaks | 100.0 /100 | #7 | Exceptional 93.6% |
| Chinese | 100.0 /100 | #8 | Exceptional 93.6% |
| Latvians | 100.0 /100 | #9 | Exceptional 93.6% |
| Croatians | 100.0 /100 | #10 | Exceptional 93.5% |
| Poles | 100.0 /100 | #11 | Exceptional 93.5% |
| Eastern Europeans | 100.0 /100 | #12 | Exceptional 93.5% |
| Danes | 100.0 /100 | #13 | Exceptional 93.5% |
| Bulgarians | 100.0 /100 | #14 | Exceptional 93.5% |
| Finns | 100.0 /100 | #15 | Exceptional 93.4% |
| Maltese | 100.0 /100 | #16 | Exceptional 93.3% |
| Luxembourgers | 100.0 /100 | #17 | Exceptional 93.3% |
| Immigrants | Singapore | 99.9 /100 | #18 | Exceptional 93.3% |
| Germans | 99.9 /100 | #19 | Exceptional 93.3% |
| Filipinos | 99.9 /100 | #20 | Exceptional 93.2% |