Paraguayan vs Tongan 12th Grade, No Diploma
COMPARE
Paraguayan
Tongan
12th Grade, No Diploma
12th Grade, No Diploma Comparison
Paraguayans
Tongans
91.5%
12TH GRADE, NO DIPLOMA
78.9/ 100
METRIC RATING
150th/ 347
METRIC RANK
90.7%
12TH GRADE, NO DIPLOMA
16.1/ 100
METRIC RATING
203rd/ 347
METRIC RANK
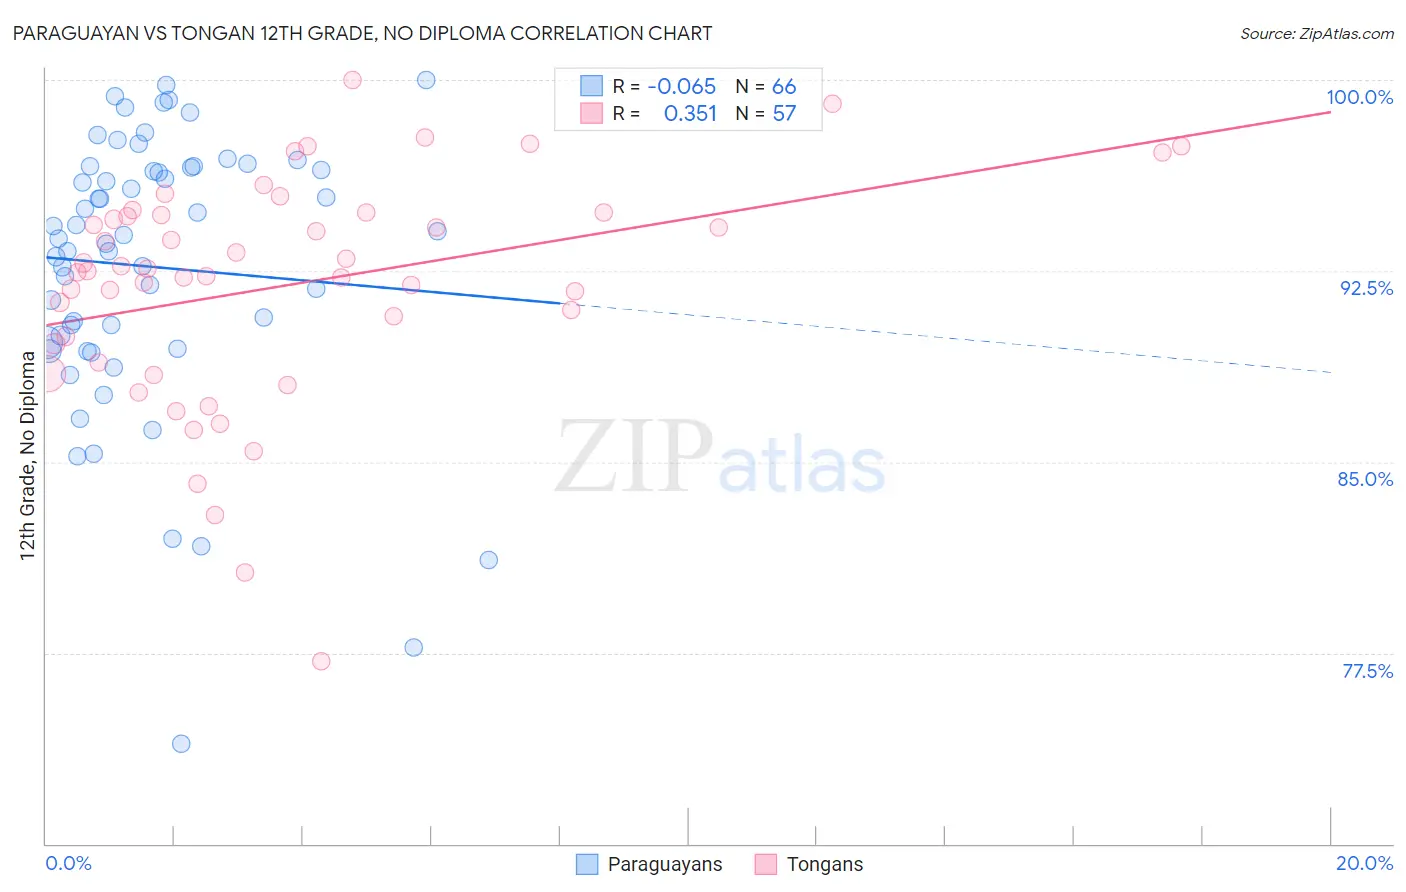
Paraguayan vs Tongan 12th Grade, No Diploma Correlation Chart
The statistical analysis conducted on geographies consisting of 95,114,201 people shows a slight negative correlation between the proportion of Paraguayans and percentage of population with at least 12th grade (no diploma) education in the United States with a correlation coefficient (R) of -0.065 and weighted average of 91.5%. Similarly, the statistical analysis conducted on geographies consisting of 102,904,773 people shows a mild positive correlation between the proportion of Tongans and percentage of population with at least 12th grade (no diploma) education in the United States with a correlation coefficient (R) of 0.351 and weighted average of 90.7%, a difference of 0.92%.
12th Grade, No Diploma Correlation Summary
| Measurement | Paraguayan | Tongan |
| Minimum | 73.9% | 77.2% |
| Maximum | 100.0% | 100.0% |
| Range | 26.1% | 22.8% |
| Mean | 92.7% | 91.9% |
| Median | 93.8% | 92.5% |
| Interquartile 25% (IQ1) | 89.7% | 89.3% |
| Interquartile 75% (IQ3) | 96.6% | 94.8% |
| Interquartile Range (IQR) | 6.9% | 5.5% |
| Standard Deviation (Sample) | 5.4% | 4.5% |
| Standard Deviation (Population) | 5.4% | 4.5% |
Similar Demographics by 12th Grade, No Diploma
Demographics Similar to Paraguayans by 12th Grade, No Diploma
In terms of 12th grade, no diploma, the demographic groups most similar to Paraguayans are Ugandan (91.5%, a difference of 0.0%), Chippewa (91.5%, a difference of 0.0%), Pakistani (91.5%, a difference of 0.010%), Indian (Asian) (91.5%, a difference of 0.010%), and Immigrants from Spain (91.6%, a difference of 0.020%).
| Demographics | Rating | Rank | 12th Grade, No Diploma |
| Immigrants | Argentina | 80.7 /100 | #143 | Excellent 91.6% |
| Immigrants | Spain | 80.1 /100 | #144 | Excellent 91.6% |
| Immigrants | Lebanon | 80.0 /100 | #145 | Excellent 91.6% |
| Immigrants | Brazil | 79.8 /100 | #146 | Good 91.5% |
| Pakistanis | 79.6 /100 | #147 | Good 91.5% |
| Indians (Asian) | 79.4 /100 | #148 | Good 91.5% |
| Ugandans | 79.0 /100 | #149 | Good 91.5% |
| Paraguayans | 78.9 /100 | #150 | Good 91.5% |
| Chippewa | 78.8 /100 | #151 | Good 91.5% |
| Kenyans | 77.4 /100 | #152 | Good 91.5% |
| Iraqis | 75.3 /100 | #153 | Good 91.5% |
| Immigrants | Kenya | 73.9 /100 | #154 | Good 91.5% |
| Immigrants | Iraq | 73.0 /100 | #155 | Good 91.4% |
| Asians | 71.9 /100 | #156 | Good 91.4% |
| Immigrants | Pakistan | 70.7 /100 | #157 | Good 91.4% |
Demographics Similar to Tongans by 12th Grade, No Diploma
In terms of 12th grade, no diploma, the demographic groups most similar to Tongans are French American Indian (90.7%, a difference of 0.010%), Immigrants from Sierra Leone (90.7%, a difference of 0.030%), Marshallese (90.7%, a difference of 0.050%), Immigrants from Southern Europe (90.8%, a difference of 0.080%), and Liberian (90.8%, a difference of 0.080%).
| Demographics | Rating | Rank | 12th Grade, No Diploma |
| Panamanians | 22.8 /100 | #196 | Fair 90.8% |
| Immigrants | Sudan | 22.6 /100 | #197 | Fair 90.8% |
| Samoans | 20.4 /100 | #198 | Fair 90.8% |
| Immigrants | Southern Europe | 19.9 /100 | #199 | Poor 90.8% |
| Liberians | 19.8 /100 | #200 | Poor 90.8% |
| Hawaiians | 19.7 /100 | #201 | Poor 90.8% |
| Marshallese | 18.2 /100 | #202 | Poor 90.7% |
| Tongans | 16.1 /100 | #203 | Poor 90.7% |
| French American Indians | 15.5 /100 | #204 | Poor 90.7% |
| Immigrants | Sierra Leone | 14.9 /100 | #205 | Poor 90.7% |
| Immigrants | Bolivia | 12.3 /100 | #206 | Poor 90.6% |
| Armenians | 11.6 /100 | #207 | Poor 90.6% |
| Immigrants | Micronesia | 11.0 /100 | #208 | Poor 90.6% |
| Immigrants | Afghanistan | 11.0 /100 | #209 | Poor 90.6% |
| South American Indians | 10.9 /100 | #210 | Poor 90.6% |