Guyanese vs Nonimmigrants 12th Grade, No Diploma
COMPARE
Guyanese
Nonimmigrants
12th Grade, No Diploma
12th Grade, No Diploma Comparison
Guyanese
Nonimmigrants
88.3%
12TH GRADE, NO DIPLOMA
0.0/ 100
METRIC RATING
294th/ 347
METRIC RANK
91.0%
12TH GRADE, NO DIPLOMA
38.8/ 100
METRIC RATING
182nd/ 347
METRIC RANK
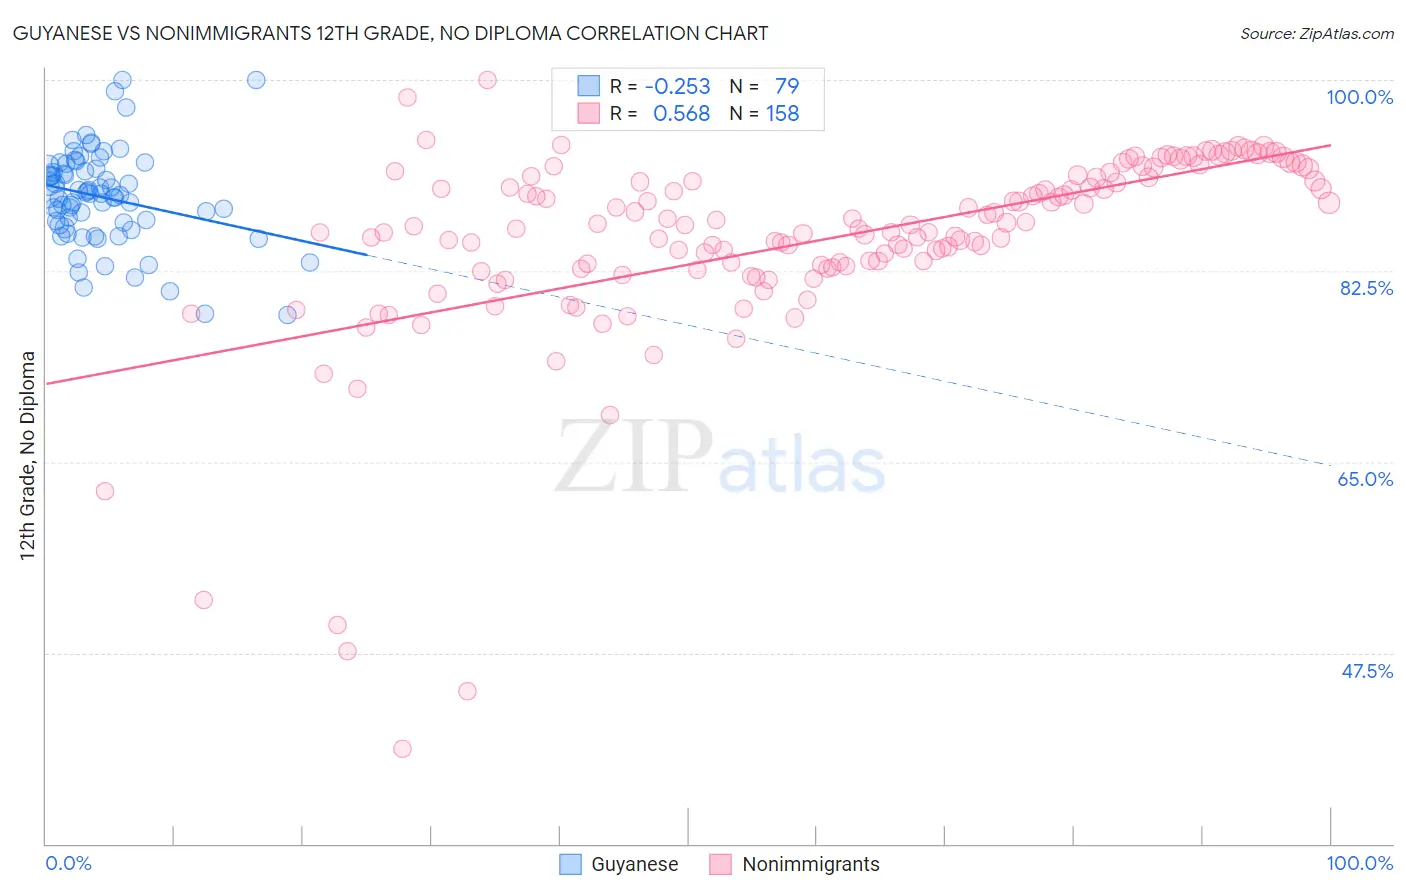
Guyanese vs Nonimmigrants 12th Grade, No Diploma Correlation Chart
The statistical analysis conducted on geographies consisting of 176,937,226 people shows a weak negative correlation between the proportion of Guyanese and percentage of population with at least 12th grade (no diploma) education in the United States with a correlation coefficient (R) of -0.253 and weighted average of 88.3%. Similarly, the statistical analysis conducted on geographies consisting of 585,370,179 people shows a substantial positive correlation between the proportion of Nonimmigrants and percentage of population with at least 12th grade (no diploma) education in the United States with a correlation coefficient (R) of 0.568 and weighted average of 91.0%, a difference of 3.2%.
12th Grade, No Diploma Correlation Summary
| Measurement | Guyanese | Nonimmigrants |
| Minimum | 78.5% | 38.7% |
| Maximum | 100.0% | 100.0% |
| Range | 21.5% | 61.3% |
| Mean | 89.2% | 85.3% |
| Median | 89.5% | 86.5% |
| Interquartile 25% (IQ1) | 86.7% | 82.8% |
| Interquartile 75% (IQ3) | 91.9% | 91.1% |
| Interquartile Range (IQR) | 5.2% | 8.3% |
| Standard Deviation (Sample) | 4.3% | 9.1% |
| Standard Deviation (Population) | 4.3% | 9.1% |
Similar Demographics by 12th Grade, No Diploma
Demographics Similar to Guyanese by 12th Grade, No Diploma
In terms of 12th grade, no diploma, the demographic groups most similar to Guyanese are Immigrants (88.2%, a difference of 0.040%), Fijian (88.2%, a difference of 0.060%), Japanese (88.3%, a difference of 0.070%), Pueblo (88.2%, a difference of 0.070%), and Immigrants from Haiti (88.2%, a difference of 0.12%).
| Demographics | Rating | Rank | 12th Grade, No Diploma |
| Hopi | 0.0 /100 | #287 | Tragic 88.6% |
| Immigrants | Fiji | 0.0 /100 | #288 | Tragic 88.6% |
| Dutch West Indians | 0.0 /100 | #289 | Tragic 88.5% |
| British West Indians | 0.0 /100 | #290 | Tragic 88.5% |
| Haitians | 0.0 /100 | #291 | Tragic 88.5% |
| Immigrants | Grenada | 0.0 /100 | #292 | Tragic 88.4% |
| Japanese | 0.0 /100 | #293 | Tragic 88.3% |
| Guyanese | 0.0 /100 | #294 | Tragic 88.3% |
| Immigrants | Immigrants | 0.0 /100 | #295 | Tragic 88.2% |
| Fijians | 0.0 /100 | #296 | Tragic 88.2% |
| Pueblo | 0.0 /100 | #297 | Tragic 88.2% |
| Immigrants | Haiti | 0.0 /100 | #298 | Tragic 88.2% |
| Nepalese | 0.0 /100 | #299 | Tragic 88.1% |
| Immigrants | Guyana | 0.0 /100 | #300 | Tragic 88.1% |
| Immigrants | Cambodia | 0.0 /100 | #301 | Tragic 88.1% |
Demographics Similar to Nonimmigrants by 12th Grade, No Diploma
In terms of 12th grade, no diploma, the demographic groups most similar to Nonimmigrants are Guamanian/Chamorro (91.0%, a difference of 0.010%), Osage (91.0%, a difference of 0.010%), Immigrants from Syria (91.1%, a difference of 0.020%), Spaniard (91.0%, a difference of 0.030%), and Spanish (91.1%, a difference of 0.060%).
| Demographics | Rating | Rank | 12th Grade, No Diploma |
| Immigrants | Western Asia | 49.0 /100 | #175 | Average 91.2% |
| Iroquois | 48.5 /100 | #176 | Average 91.1% |
| Sierra Leoneans | 47.7 /100 | #177 | Average 91.1% |
| Spanish | 43.7 /100 | #178 | Average 91.1% |
| Immigrants | Chile | 43.3 /100 | #179 | Average 91.1% |
| Immigrants | Syria | 40.3 /100 | #180 | Average 91.1% |
| Guamanians/Chamorros | 39.5 /100 | #181 | Fair 91.0% |
| Immigrants | Nonimmigrants | 38.8 /100 | #182 | Fair 91.0% |
| Osage | 38.3 /100 | #183 | Fair 91.0% |
| Spaniards | 36.2 /100 | #184 | Fair 91.0% |
| Sudanese | 34.4 /100 | #185 | Fair 91.0% |
| Ethiopians | 33.9 /100 | #186 | Fair 91.0% |
| Potawatomi | 32.9 /100 | #187 | Fair 91.0% |
| Americans | 32.6 /100 | #188 | Fair 91.0% |
| Immigrants | Uganda | 31.6 /100 | #189 | Fair 90.9% |