Paraguayan vs Tohono O'odham College, Under 1 year
COMPARE
Paraguayan
Tohono O'odham
College, Under 1 year
College, Under 1 year Comparison
Paraguayans
Tohono O'odham
67.9%
COLLEGE, UNDER 1 YEAR
97.1/ 100
METRIC RATING
98th/ 347
METRIC RANK
52.8%
COLLEGE, UNDER 1 YEAR
0.0/ 100
METRIC RATING
343rd/ 347
METRIC RANK
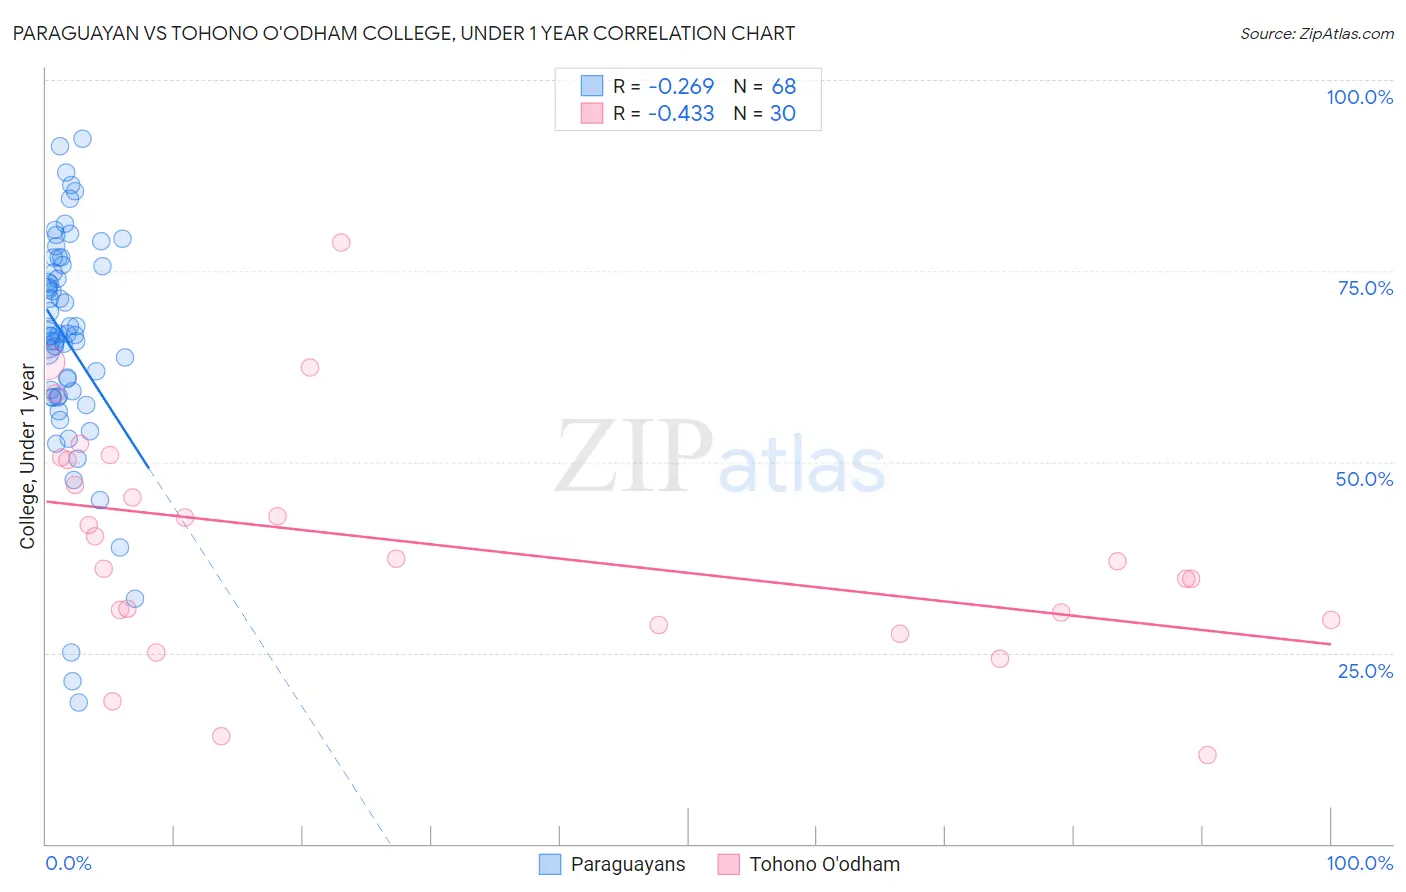
Paraguayan vs Tohono O'odham College, Under 1 year Correlation Chart
The statistical analysis conducted on geographies consisting of 95,113,072 people shows a weak negative correlation between the proportion of Paraguayans and percentage of population with at least college, under 1 year education in the United States with a correlation coefficient (R) of -0.269 and weighted average of 67.9%. Similarly, the statistical analysis conducted on geographies consisting of 58,730,051 people shows a moderate negative correlation between the proportion of Tohono O'odham and percentage of population with at least college, under 1 year education in the United States with a correlation coefficient (R) of -0.433 and weighted average of 52.8%, a difference of 28.7%.
College, Under 1 year Correlation Summary
| Measurement | Paraguayan | Tohono O'odham |
| Minimum | 18.4% | 11.6% |
| Maximum | 92.3% | 78.8% |
| Range | 73.8% | 67.2% |
| Mean | 65.7% | 39.3% |
| Median | 66.7% | 37.1% |
| Interquartile 25% (IQ1) | 58.5% | 29.3% |
| Interquartile 75% (IQ3) | 75.7% | 50.2% |
| Interquartile Range (IQR) | 17.1% | 20.9% |
| Standard Deviation (Sample) | 15.1% | 15.1% |
| Standard Deviation (Population) | 15.0% | 14.9% |
Similar Demographics by College, Under 1 year
Demographics Similar to Paraguayans by College, Under 1 year
In terms of college, under 1 year, the demographic groups most similar to Paraguayans are Immigrants from Bolivia (67.9%, a difference of 0.020%), Immigrants from Argentina (67.9%, a difference of 0.030%), Immigrants from Eastern Europe (67.9%, a difference of 0.080%), Palestinian (67.9%, a difference of 0.080%), and Carpatho Rusyn (67.9%, a difference of 0.090%).
| Demographics | Rating | Rank | College, Under 1 year |
| Europeans | 98.1 /100 | #91 | Exceptional 68.2% |
| Luxembourgers | 98.1 /100 | #92 | Exceptional 68.2% |
| Romanians | 97.9 /100 | #93 | Exceptional 68.2% |
| Armenians | 97.7 /100 | #94 | Exceptional 68.1% |
| Immigrants | Pakistan | 97.5 /100 | #95 | Exceptional 68.0% |
| Jordanians | 97.4 /100 | #96 | Exceptional 68.0% |
| Immigrants | Ethiopia | 97.3 /100 | #97 | Exceptional 68.0% |
| Paraguayans | 97.1 /100 | #98 | Exceptional 67.9% |
| Immigrants | Bolivia | 97.0 /100 | #99 | Exceptional 67.9% |
| Immigrants | Argentina | 97.0 /100 | #100 | Exceptional 67.9% |
| Immigrants | Eastern Europe | 96.9 /100 | #101 | Exceptional 67.9% |
| Palestinians | 96.9 /100 | #102 | Exceptional 67.9% |
| Carpatho Rusyns | 96.8 /100 | #103 | Exceptional 67.9% |
| Immigrants | Western Asia | 96.6 /100 | #104 | Exceptional 67.8% |
| Afghans | 96.6 /100 | #105 | Exceptional 67.8% |
Demographics Similar to Tohono O'odham by College, Under 1 year
In terms of college, under 1 year, the demographic groups most similar to Tohono O'odham are Yakama (52.6%, a difference of 0.30%), Immigrants from Mexico (53.7%, a difference of 1.6%), Immigrants from Cabo Verde (53.7%, a difference of 1.7%), Spanish American Indian (54.0%, a difference of 2.2%), and Immigrants from Dominican Republic (54.0%, a difference of 2.3%).
| Demographics | Rating | Rank | College, Under 1 year |
| Yuman | 0.0 /100 | #333 | Tragic 55.1% |
| Immigrants | Azores | 0.0 /100 | #334 | Tragic 54.7% |
| Inupiat | 0.0 /100 | #335 | Tragic 54.6% |
| Pennsylvania Germans | 0.0 /100 | #336 | Tragic 54.5% |
| Immigrants | Central America | 0.0 /100 | #337 | Tragic 54.4% |
| Lumbee | 0.0 /100 | #338 | Tragic 54.2% |
| Immigrants | Dominican Republic | 0.0 /100 | #339 | Tragic 54.0% |
| Spanish American Indians | 0.0 /100 | #340 | Tragic 54.0% |
| Immigrants | Cabo Verde | 0.0 /100 | #341 | Tragic 53.7% |
| Immigrants | Mexico | 0.0 /100 | #342 | Tragic 53.7% |
| Tohono O'odham | 0.0 /100 | #343 | Tragic 52.8% |
| Yakama | 0.0 /100 | #344 | Tragic 52.6% |
| Pima | 0.0 /100 | #345 | Tragic 51.4% |
| Houma | 0.0 /100 | #346 | Tragic 47.6% |
| Yup'ik | 0.0 /100 | #347 | Tragic 45.8% |