Croatian vs Immigrants from Moldova Associate's Degree

COMPARE

Croatian
Race
Ancestry
AfghanAfricanAlaska NativeAlaskan AthabascanAlbanianAleutAlsatianAmericanApacheArabArapahoArgentineanArmenianAssyrian/Chaldean/SyriacAustralianAustrianBahamianBangladeshiBarbadianBasqueBelgianBelizeanBermudanBhutaneseBlackfeetBolivianBrazilianBritishBritish West IndianBulgarianBurmeseCajunCambodianCanadianCape VerdeanCarpatho RusynCelticCentral AmericanCentral American IndianCherokeeCheyenneChickasawChileanChineseChippewaChoctawColombianColvilleComancheCosta RicanCreeCreekCroatianCrowCubanCypriotCzechCzechoslovakianDanishDelawareDominicanDutchDutch West IndianEastern EuropeanEcuadorianEgyptianEnglishEstonianEthiopianEuropeanFijianFilipinoFinnishFrenchFrench American IndianFrench CanadianGermanGerman RussianGhanaianGreekGuamanian/ChamorroGuatemalanGuyaneseHaitianHmongHonduranHopiHoumaHungarianIcelanderIndian (Asian)IndonesianInupiatIranianIraqiIrishIroquoisIsraeliItalianJamaicanJapaneseJordanianKenyanKiowaKoreanLaotianLatvianLebaneseLiberianLithuanianLumbeeLuxembourgerMacedonianMalaysianMalteseMarshalleseMenomineeMexicanMexican American IndianMongolianMoroccanNative HawaiianNavajoNepaleseNew ZealanderNicaraguanNigerianNorthern EuropeanNorwegianOkinawanOsageOttawaPaiutePakistaniPalestinianPanamanianParaguayanPennsylvania GermanPeruvianPimaPolishPortuguesePotawatomiPuebloPuerto RicanPuget Sound SalishRomanianRussianSalvadoranSamoanScandinavianScotch-IrishScottishSeminoleSenegaleseSerbianShoshoneSierra LeoneanSiouxSlavicSlovakSloveneSomaliSouth AfricanSouth AmericanSouth American IndianSoviet UnionSpaniardSpanishSpanish AmericanSpanish American IndianSri LankanSubsaharan AfricanSudaneseSwedishSwissSyrianTaiwaneseThaiTlingit-HaidaTohono O'OdhamTonganTrinidadian and TobagonianTsimshianTurkishU.S. Virgin IslanderUgandanUkrainianUruguayanUteVenezuelanVietnameseWelshWest IndianYakamaYaquiYugoslavianYumanYup'ikZimbabwean
Immigration
NonimmigrantsImmigrantsAfghanistanAfricaAlbaniaArgentinaArmeniaAsiaAustraliaAustriaBahamasBangladeshBarbadosBelarusBelgiumBelizeBoliviaBosnia and HerzegovinaBrazilBulgariaBurma/MyanmarCabo VerdeCambodiaCameroonCanadaCaribbeanCentral AmericaChileChinaColombiaCongoCosta RicaCroatiaCubaCzechoslovakiaDenmarkDominicaDominican RepublicEastern AfricaEastern AsiaEastern EuropeEcuadorEgyptEl SalvadorEnglandEritreaEthiopiaEuropeFijiFranceGermanyGhanaGreeceGrenadaGuatemalaGuyanaHaitiHondurasHong KongHungaryIndiaIndonesiaIranIraqIrelandIsraelItalyJamaicaJapanJordanKazakhstanKenyaKoreaKuwaitLaosLatin AmericaLatviaLebanonLiberiaLithuaniaMalaysiaMexicoMicronesiaMiddle AfricaMoroccoNepalNetherlandsNicaraguaNigeriaNorth AmericaNorth MacedoniaNorthern AfricaNorthern EuropeNorwayOceaniaPakistanPanamaPeruPhilippinesPolandPortugalRomaniaRussiaSaudi ArabiaScotlandSenegalSerbiaSierra LeoneSingaporeSomaliaSouth AfricaSouth AmericaSouth Central AsiaSouth Eastern AsiaSouthern EuropeSpainSri LankaSt. Vincent and the GrenadinesSudanSwedenSwitzerlandSyriaTaiwanThailandTrinidad and TobagoTurkeyUgandaUkraineUruguayUzbekistanVenezuelaVietnamWest IndiesWestern AfricaWestern AsiaWestern EuropeYemenZaireZimbabweAzores
Immigrants from Moldova
Race
Ancestry
AfghanAfricanAlaska NativeAlaskan AthabascanAlbanianAleutAlsatianAmericanApacheArabArapahoArgentineanArmenianAssyrian/Chaldean/SyriacAustralianAustrianBahamianBangladeshiBarbadianBasqueBelgianBelizeanBermudanBhutaneseBlackfeetBolivianBrazilianBritishBritish West IndianBulgarianBurmeseCajunCambodianCanadianCape VerdeanCarpatho RusynCelticCentral AmericanCentral American IndianCherokeeCheyenneChickasawChileanChineseChippewaChoctawColombianColvilleComancheCosta RicanCreeCreekCrowCubanCypriotCzechCzechoslovakianDanishDelawareDominicanDutchDutch West IndianEastern EuropeanEcuadorianEgyptianEnglishEstonianEthiopianEuropeanFijianFilipinoFinnishFrenchFrench American IndianFrench CanadianGermanGerman RussianGhanaianGreekGuamanian/ChamorroGuatemalanGuyaneseHaitianHmongHonduranHopiHoumaHungarianIcelanderIndian (Asian)IndonesianInupiatIranianIraqiIrishIroquoisIsraeliItalianJamaicanJapaneseJordanianKenyanKiowaKoreanLaotianLatvianLebaneseLiberianLithuanianLumbeeLuxembourgerMacedonianMalaysianMalteseMarshalleseMenomineeMexicanMexican American IndianMongolianMoroccanNative HawaiianNavajoNepaleseNew ZealanderNicaraguanNigerianNorthern EuropeanNorwegianOkinawanOsageOttawaPaiutePakistaniPalestinianPanamanianParaguayanPennsylvania GermanPeruvianPimaPolishPortuguesePotawatomiPuebloPuerto RicanPuget Sound SalishRomanianRussianSalvadoranSamoanScandinavianScotch-IrishScottishSeminoleSenegaleseSerbianShoshoneSierra LeoneanSiouxSlavicSlovakSloveneSomaliSouth AfricanSouth AmericanSouth American IndianSoviet UnionSpaniardSpanishSpanish AmericanSpanish American IndianSri LankanSubsaharan AfricanSudaneseSwedishSwissSyrianTaiwaneseThaiTlingit-HaidaTohono O'OdhamTonganTrinidadian and TobagonianTsimshianTurkishU.S. Virgin IslanderUgandanUkrainianUruguayanUteVenezuelanVietnameseWelshWest IndianYakamaYaquiYugoslavianYumanYup'ikZimbabwean
Immigration
NonimmigrantsImmigrantsAfghanistanAfricaAlbaniaArgentinaArmeniaAsiaAustraliaAustriaBahamasBangladeshBarbadosBelarusBelgiumBelizeBoliviaBosnia and HerzegovinaBrazilBulgariaBurma/MyanmarCabo VerdeCambodiaCameroonCanadaCaribbeanCentral AmericaChileChinaColombiaCongoCosta RicaCroatiaCubaCzechoslovakiaDenmarkDominicaDominican RepublicEastern AfricaEastern AsiaEastern EuropeEcuadorEgyptEl SalvadorEnglandEritreaEthiopiaEuropeFijiFranceGermanyGhanaGreeceGrenadaGuatemalaGuyanaHaitiHondurasHong KongHungaryIndiaIndonesiaIranIraqIrelandIsraelItalyJamaicaJapanJordanKazakhstanKenyaKoreaKuwaitLaosLatin AmericaLatviaLebanonLiberiaLithuaniaMalaysiaMexicoMicronesiaMiddle AfricaMoldovaMoroccoNepalNetherlandsNicaraguaNigeriaNorth AmericaNorth MacedoniaNorthern AfricaNorthern EuropeNorwayOceaniaPakistanPanamaPeruPhilippinesPolandPortugalRomaniaRussiaSaudi ArabiaScotlandSenegalSerbiaSierra LeoneSingaporeSomaliaSouth AfricaSouth AmericaSouth Central AsiaSouth Eastern AsiaSouthern EuropeSpainSri LankaSt. Vincent and the GrenadinesSudanSwedenSwitzerlandSyriaTaiwanThailandTrinidad and TobagoTurkeyUgandaUkraineUruguayUzbekistanVenezuelaVietnamWest IndiesWestern AfricaWestern AsiaWestern EuropeYemenZaireZimbabweAzores
Associate's Degree
Income
Poverty
Unemployment
Labor Participation
Family Structure
Vehicle Availability
Education Level
Disability

Associate's Degree Comparison

Croatians

Immigrants from Moldova

Exceptional
Exceptional
49.3%
ASSOCIATE'S DEGREE
96.8/ 100
METRIC RATING
105th/ 347
METRIC RANK
50.2%
ASSOCIATE'S DEGREE
98.8/ 100
METRIC RATING
87th/ 347
METRIC RANK

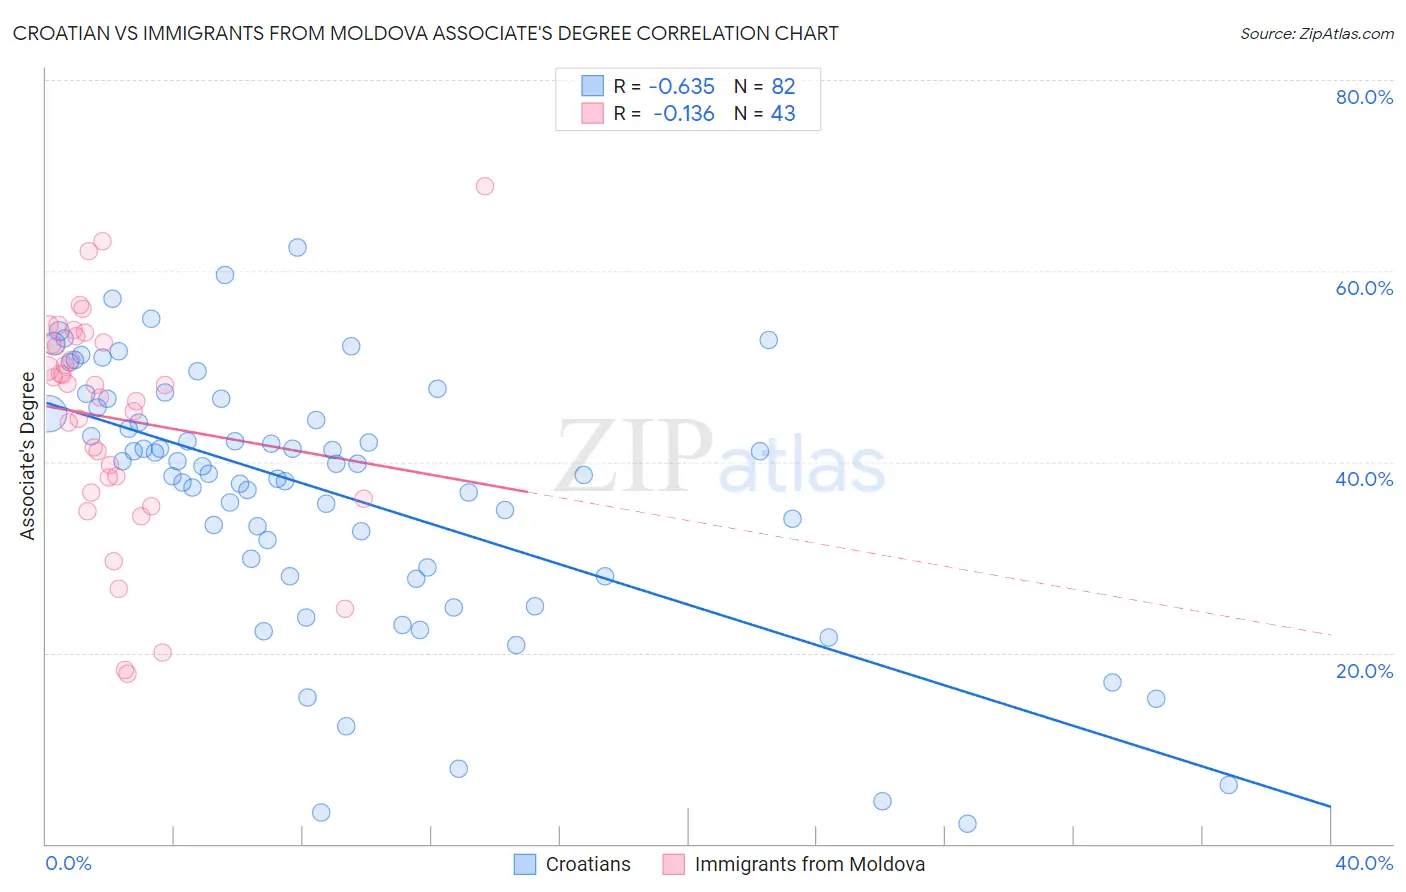
Croatian vs Immigrants from Moldova Associate's Degree Correlation Chart

The statistical analysis conducted on geographies consisting of 375,715,670 people shows a significant negative correlation between the proportion of Croatians and percentage of population with at least associate's degree education in the United States with a correlation coefficient (R) of -0.635 and weighted average of 49.3%. Similarly, the statistical analysis conducted on geographies consisting of 124,396,308 people shows a poor negative correlation between the proportion of Immigrants from Moldova and percentage of population with at least associate's degree education in the United States with a correlation coefficient (R) of -0.136 and weighted average of 50.2%, a difference of 1.8%.
Croatian vs Immigrants from Moldova Associate's Degree

Associate's Degree Correlation Summary

MeasurementCroatianImmigrants from Moldova
Minimum2.1%17.8%
Maximum62.5%68.9%
Range60.4%51.1%
Mean36.8%44.5%
Median39.7%48.0%
Interquartile 25% (IQ1)29.0%36.7%
Interquartile 75% (IQ3)45.8%52.6%
Interquartile Range (IQR)16.8%15.8%
Standard Deviation (Sample)13.4%11.8%
Standard Deviation (Population)13.4%11.6%

Demographics Similar to Croatians and Immigrants from Moldova by Associate's Degree

In terms of associate's degree, the demographic groups most similar to Croatians are Immigrants from Italy (49.3%, a difference of 0.0%), Venezuelan (49.4%, a difference of 0.15%), Ukrainian (49.4%, a difference of 0.21%), Chilean (49.4%, a difference of 0.31%), and Northern European (49.5%, a difference of 0.34%). Similarly, the demographic groups most similar to Immigrants from Moldova are Immigrants from Canada (50.1%, a difference of 0.070%), Immigrants from Western Europe (50.1%, a difference of 0.080%), Immigrants from Ethiopia (50.1%, a difference of 0.080%), Immigrants from Croatia (50.2%, a difference of 0.12%), and Immigrants from Western Asia (50.1%, a difference of 0.16%).
DemographicsRating | RankAssociate's Degree
Immigrants | Croatia
98.9
/100
|
#86
Exceptional
50.2%
Immigrants | Moldova
98.8
/100
|
#87
Exceptional
50.2%
Immigrants | Canada
98.7
/100
|
#88
Exceptional
50.1%
Immigrants | Western Europe
98.7
/100
|
#89
Exceptional
50.1%
Immigrants | Ethiopia
98.7
/100
|
#90
Exceptional
50.1%
Immigrants | Western Asia
98.7
/100
|
#91
Exceptional
50.1%
Immigrants | North America
98.7
/100
|
#92
Exceptional
50.1%
Immigrants | Brazil
98.5
/100
|
#93
Exceptional
50.0%
Laotians
98.4
/100
|
#94
Exceptional
49.9%
Immigrants | England
98.0
/100
|
#95
Exceptional
49.7%
Romanians
98.0
/100
|
#96
Exceptional
49.7%
Immigrants | Ukraine
98.0
/100
|
#97
Exceptional
49.7%
Immigrants | Northern Africa
97.9
/100
|
#98
Exceptional
49.7%
Macedonians
97.8
/100
|
#99
Exceptional
49.6%
Immigrants | Nepal
97.5
/100
|
#100
Exceptional
49.5%
Northern Europeans
97.3
/100
|
#101
Exceptional
49.5%
Chileans
97.3
/100
|
#102
Exceptional
49.4%
Ukrainians
97.1
/100
|
#103
Exceptional
49.4%
Venezuelans
97.0
/100
|
#104
Exceptional
49.4%
Croatians
96.8
/100
|
#105
Exceptional
49.3%
Immigrants | Italy
96.7
/100
|
#106
Exceptional
49.3%