French vs Immigrants from Malaysia Master's Degree
COMPARE
French
Immigrants from Malaysia
Master's Degree
Master's Degree Comparison
French
Immigrants from Malaysia
14.4%
MASTER'S DEGREE
23.7/ 100
METRIC RATING
204th/ 347
METRIC RANK
18.9%
MASTER'S DEGREE
100.0/ 100
METRIC RATING
44th/ 347
METRIC RANK
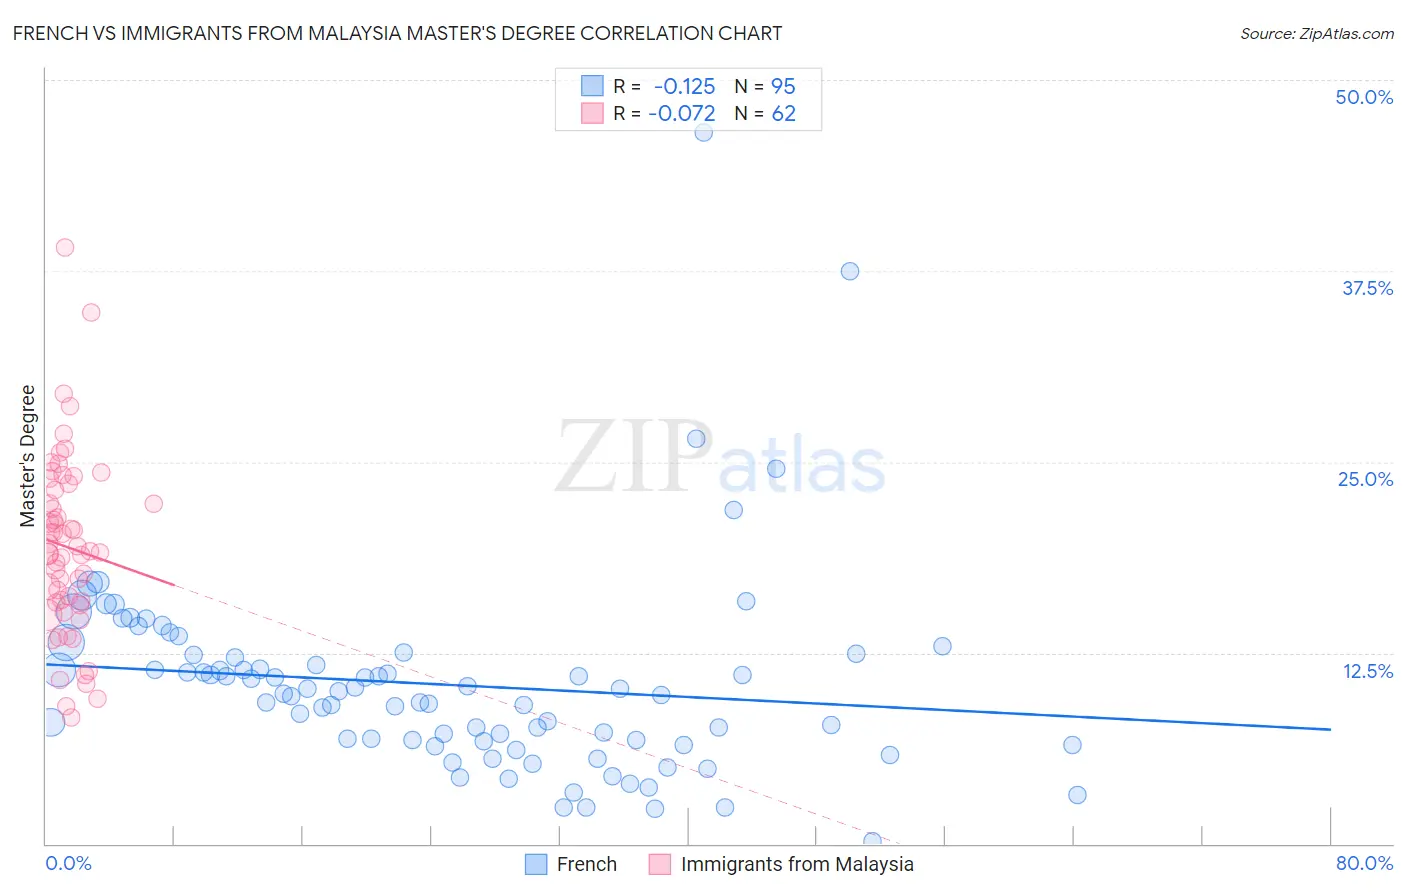
French vs Immigrants from Malaysia Master's Degree Correlation Chart
The statistical analysis conducted on geographies consisting of 571,581,323 people shows a poor negative correlation between the proportion of French and percentage of population with at least master's degree education in the United States with a correlation coefficient (R) of -0.125 and weighted average of 14.4%. Similarly, the statistical analysis conducted on geographies consisting of 197,962,385 people shows a slight negative correlation between the proportion of Immigrants from Malaysia and percentage of population with at least master's degree education in the United States with a correlation coefficient (R) of -0.072 and weighted average of 18.9%, a difference of 31.7%.
Master's Degree Correlation Summary
| Measurement | French | Immigrants from Malaysia |
| Minimum | 0.20% | 8.3% |
| Maximum | 46.6% | 39.1% |
| Range | 46.4% | 30.8% |
| Mean | 10.4% | 19.4% |
| Median | 9.8% | 19.1% |
| Interquartile 25% (IQ1) | 6.7% | 15.8% |
| Interquartile 75% (IQ3) | 12.4% | 23.1% |
| Interquartile Range (IQR) | 5.7% | 7.3% |
| Standard Deviation (Sample) | 6.6% | 5.9% |
| Standard Deviation (Population) | 6.6% | 5.8% |
Similar Demographics by Master's Degree
Demographics Similar to French by Master's Degree
In terms of master's degree, the demographic groups most similar to French are Trinidadian and Tobagonian (14.4%, a difference of 0.030%), Scandinavian (14.4%, a difference of 0.070%), Yugoslavian (14.4%, a difference of 0.11%), Immigrants from Western Africa (14.4%, a difference of 0.22%), and Scotch-Irish (14.4%, a difference of 0.24%).
| Demographics | Rating | Rank | Master's Degree |
| Belgians | 28.0 /100 | #197 | Fair 14.5% |
| West Indians | 27.4 /100 | #198 | Fair 14.5% |
| Immigrants | Armenia | 27.2 /100 | #199 | Fair 14.5% |
| Panamanians | 25.1 /100 | #200 | Fair 14.4% |
| Scotch-Irish | 25.0 /100 | #201 | Fair 14.4% |
| Immigrants | Western Africa | 24.9 /100 | #202 | Fair 14.4% |
| Yugoslavians | 24.3 /100 | #203 | Fair 14.4% |
| French | 23.7 /100 | #204 | Fair 14.4% |
| Trinidadians and Tobagonians | 23.5 /100 | #205 | Fair 14.4% |
| Scandinavians | 23.3 /100 | #206 | Fair 14.4% |
| Immigrants | Bosnia and Herzegovina | 22.0 /100 | #207 | Fair 14.3% |
| Immigrants | Barbados | 20.5 /100 | #208 | Fair 14.3% |
| Immigrants | Panama | 20.0 /100 | #209 | Fair 14.3% |
| Sub-Saharan Africans | 19.4 /100 | #210 | Poor 14.2% |
| Somalis | 18.0 /100 | #211 | Poor 14.2% |
Demographics Similar to Immigrants from Malaysia by Master's Degree
In terms of master's degree, the demographic groups most similar to Immigrants from Malaysia are Immigrants from Belarus (18.9%, a difference of 0.11%), Immigrants from Greece (19.0%, a difference of 0.28%), Immigrants from Saudi Arabia (19.0%, a difference of 0.29%), Immigrants from Norway (18.8%, a difference of 0.50%), and Immigrants from Austria (18.8%, a difference of 0.51%).
| Demographics | Rating | Rank | Master's Degree |
| Mongolians | 100.0 /100 | #37 | Exceptional 19.4% |
| Bolivians | 100.0 /100 | #38 | Exceptional 19.3% |
| Immigrants | Spain | 100.0 /100 | #39 | Exceptional 19.1% |
| Immigrants | Bolivia | 100.0 /100 | #40 | Exceptional 19.1% |
| Immigrants | Latvia | 100.0 /100 | #41 | Exceptional 19.1% |
| Immigrants | Saudi Arabia | 100.0 /100 | #42 | Exceptional 19.0% |
| Immigrants | Greece | 100.0 /100 | #43 | Exceptional 19.0% |
| Immigrants | Malaysia | 100.0 /100 | #44 | Exceptional 18.9% |
| Immigrants | Belarus | 100.0 /100 | #45 | Exceptional 18.9% |
| Immigrants | Norway | 100.0 /100 | #46 | Exceptional 18.8% |
| Immigrants | Austria | 100.0 /100 | #47 | Exceptional 18.8% |
| Paraguayans | 100.0 /100 | #48 | Exceptional 18.8% |
| Estonians | 100.0 /100 | #49 | Exceptional 18.8% |
| Bulgarians | 100.0 /100 | #50 | Exceptional 18.8% |
| Immigrants | South Africa | 100.0 /100 | #51 | Exceptional 18.8% |