Immigrants from Malaysia vs Immigrants from Grenada Doctorate Degree

COMPARE

Immigrants from Malaysia
Race
Ancestry
AfghanAfricanAlaska NativeAlaskan AthabascanAlbanianAleutAlsatianAmericanApacheArabArapahoArgentineanArmenianAssyrian/Chaldean/SyriacAustralianAustrianBahamianBangladeshiBarbadianBasqueBelgianBelizeanBermudanBhutaneseBlackfeetBolivianBrazilianBritishBritish West IndianBulgarianBurmeseCajunCambodianCanadianCape VerdeanCarpatho RusynCelticCentral AmericanCentral American IndianCherokeeCheyenneChickasawChileanChineseChippewaChoctawColombianColvilleComancheCosta RicanCreeCreekCroatianCrowCubanCypriotCzechCzechoslovakianDanishDelawareDominicanDutchDutch West IndianEastern EuropeanEcuadorianEgyptianEnglishEstonianEthiopianEuropeanFijianFilipinoFinnishFrenchFrench American IndianFrench CanadianGermanGerman RussianGhanaianGreekGuamanian/ChamorroGuatemalanGuyaneseHaitianHmongHonduranHopiHoumaHungarianIcelanderIndian (Asian)IndonesianInupiatIranianIraqiIrishIroquoisIsraeliItalianJamaicanJapaneseJordanianKenyanKiowaKoreanLaotianLatvianLebaneseLiberianLithuanianLumbeeLuxembourgerMacedonianMalaysianMalteseMarshalleseMenomineeMexicanMexican American IndianMongolianMoroccanNative HawaiianNavajoNepaleseNew ZealanderNicaraguanNigerianNorthern EuropeanNorwegianOkinawanOsageOttawaPaiutePakistaniPalestinianPanamanianParaguayanPennsylvania GermanPeruvianPimaPolishPortuguesePotawatomiPuebloPuerto RicanPuget Sound SalishRomanianRussianSalvadoranSamoanScandinavianScotch-IrishScottishSeminoleSenegaleseSerbianShoshoneSierra LeoneanSiouxSlavicSlovakSloveneSomaliSouth AfricanSouth AmericanSouth American IndianSoviet UnionSpaniardSpanishSpanish AmericanSpanish American IndianSri LankanSubsaharan AfricanSudaneseSwedishSwissSyrianTaiwaneseThaiTlingit-HaidaTohono O'OdhamTonganTrinidadian and TobagonianTsimshianTurkishU.S. Virgin IslanderUgandanUkrainianUruguayanUteVenezuelanVietnameseWelshWest IndianYakamaYaquiYugoslavianYumanYup'ikZimbabwean
Immigration
NonimmigrantsImmigrantsAfghanistanAfricaAlbaniaArgentinaArmeniaAsiaAustraliaAustriaBahamasBangladeshBarbadosBelarusBelgiumBelizeBoliviaBosnia and HerzegovinaBrazilBulgariaBurma/MyanmarCabo VerdeCambodiaCameroonCanadaCaribbeanCentral AmericaChileChinaColombiaCongoCosta RicaCroatiaCubaCzechoslovakiaDenmarkDominicaDominican RepublicEastern AfricaEastern AsiaEastern EuropeEcuadorEgyptEl SalvadorEnglandEritreaEthiopiaEuropeFijiFranceGermanyGhanaGreeceGuatemalaGuyanaHaitiHondurasHong KongHungaryIndiaIndonesiaIranIraqIrelandIsraelItalyJamaicaJapanJordanKazakhstanKenyaKoreaKuwaitLaosLatin AmericaLatviaLebanonLiberiaLithuaniaMalaysiaMexicoMicronesiaMiddle AfricaMoldovaMoroccoNepalNetherlandsNicaraguaNigeriaNorth AmericaNorth MacedoniaNorthern AfricaNorthern EuropeNorwayOceaniaPakistanPanamaPeruPhilippinesPolandPortugalRomaniaRussiaSaudi ArabiaScotlandSenegalSerbiaSierra LeoneSingaporeSomaliaSouth AfricaSouth AmericaSouth Central AsiaSouth Eastern AsiaSouthern EuropeSpainSri LankaSt. Vincent and the GrenadinesSudanSwedenSwitzerlandSyriaTaiwanThailandTrinidad and TobagoTurkeyUgandaUkraineUruguayUzbekistanVenezuelaVietnamWest IndiesWestern AfricaWestern AsiaWestern EuropeYemenZaireZimbabweAzores
Immigrants from Grenada
Race
Ancestry
AfghanAfricanAlaska NativeAlaskan AthabascanAlbanianAleutAlsatianAmericanApacheArabArapahoArgentineanArmenianAssyrian/Chaldean/SyriacAustralianAustrianBahamianBangladeshiBarbadianBasqueBelgianBelizeanBermudanBhutaneseBlackfeetBolivianBrazilianBritishBritish West IndianBulgarianBurmeseCajunCambodianCanadianCape VerdeanCarpatho RusynCelticCentral AmericanCentral American IndianCherokeeCheyenneChickasawChileanChineseChippewaChoctawColombianColvilleComancheCosta RicanCreeCreekCroatianCrowCubanCypriotCzechCzechoslovakianDanishDelawareDominicanDutchDutch West IndianEastern EuropeanEcuadorianEgyptianEnglishEstonianEthiopianEuropeanFijianFilipinoFinnishFrenchFrench American IndianFrench CanadianGermanGerman RussianGhanaianGreekGuamanian/ChamorroGuatemalanGuyaneseHaitianHmongHonduranHopiHoumaHungarianIcelanderIndian (Asian)IndonesianInupiatIranianIraqiIrishIroquoisIsraeliItalianJamaicanJapaneseJordanianKenyanKiowaKoreanLaotianLatvianLebaneseLiberianLithuanianLumbeeLuxembourgerMacedonianMalaysianMalteseMarshalleseMenomineeMexicanMexican American IndianMongolianMoroccanNative HawaiianNavajoNepaleseNew ZealanderNicaraguanNigerianNorthern EuropeanNorwegianOkinawanOsageOttawaPaiutePakistaniPalestinianPanamanianParaguayanPennsylvania GermanPeruvianPimaPolishPortuguesePotawatomiPuebloPuerto RicanPuget Sound SalishRomanianRussianSalvadoranSamoanScandinavianScotch-IrishScottishSeminoleSenegaleseSerbianShoshoneSierra LeoneanSiouxSlavicSlovakSloveneSomaliSouth AfricanSouth AmericanSouth American IndianSoviet UnionSpaniardSpanishSpanish AmericanSpanish American IndianSri LankanSubsaharan AfricanSudaneseSwedishSwissSyrianTaiwaneseThaiTlingit-HaidaTohono O'OdhamTonganTrinidadian and TobagonianTsimshianTurkishU.S. Virgin IslanderUgandanUkrainianUruguayanUteVenezuelanVietnameseWelshWest IndianYakamaYaquiYugoslavianYumanYup'ikZimbabwean
Immigration
NonimmigrantsImmigrantsAfghanistanAfricaAlbaniaArgentinaArmeniaAsiaAustraliaAustriaBahamasBangladeshBarbadosBelarusBelgiumBelizeBoliviaBosnia and HerzegovinaBrazilBulgariaBurma/MyanmarCabo VerdeCambodiaCameroonCanadaCaribbeanCentral AmericaChileChinaColombiaCongoCosta RicaCroatiaCubaCzechoslovakiaDenmarkDominicaDominican RepublicEastern AfricaEastern AsiaEastern EuropeEcuadorEgyptEl SalvadorEnglandEritreaEthiopiaEuropeFijiFranceGermanyGhanaGreeceGrenadaGuatemalaGuyanaHaitiHondurasHong KongHungaryIndiaIndonesiaIranIraqIrelandIsraelItalyJamaicaJapanJordanKazakhstanKenyaKoreaKuwaitLaosLatin AmericaLatviaLebanonLiberiaLithuaniaMexicoMicronesiaMiddle AfricaMoldovaMoroccoNepalNetherlandsNicaraguaNigeriaNorth AmericaNorth MacedoniaNorthern AfricaNorthern EuropeNorwayOceaniaPakistanPanamaPeruPhilippinesPolandPortugalRomaniaRussiaSaudi ArabiaScotlandSenegalSerbiaSierra LeoneSingaporeSomaliaSouth AfricaSouth AmericaSouth Central AsiaSouth Eastern AsiaSouthern EuropeSpainSri LankaSt. Vincent and the GrenadinesSudanSwedenSwitzerlandSyriaTaiwanThailandTrinidad and TobagoTurkeyUgandaUkraineUruguayUzbekistanVenezuelaVietnamWest IndiesWestern AfricaWestern AsiaWestern EuropeYemenZaireZimbabweAzores
Doctorate Degree
Income
Poverty
Unemployment
Labor Participation
Family Structure
Vehicle Availability
Education Level
Disability

Doctorate Degree Comparison

Immigrants from Malaysia

Immigrants from Grenada

Exceptional
Tragic
2.6%
DOCTORATE DEGREE
100.0/ 100
METRIC RATING
35th/ 347
METRIC RANK
1.4%
DOCTORATE DEGREE
0.1/ 100
METRIC RATING
309th/ 347
METRIC RANK

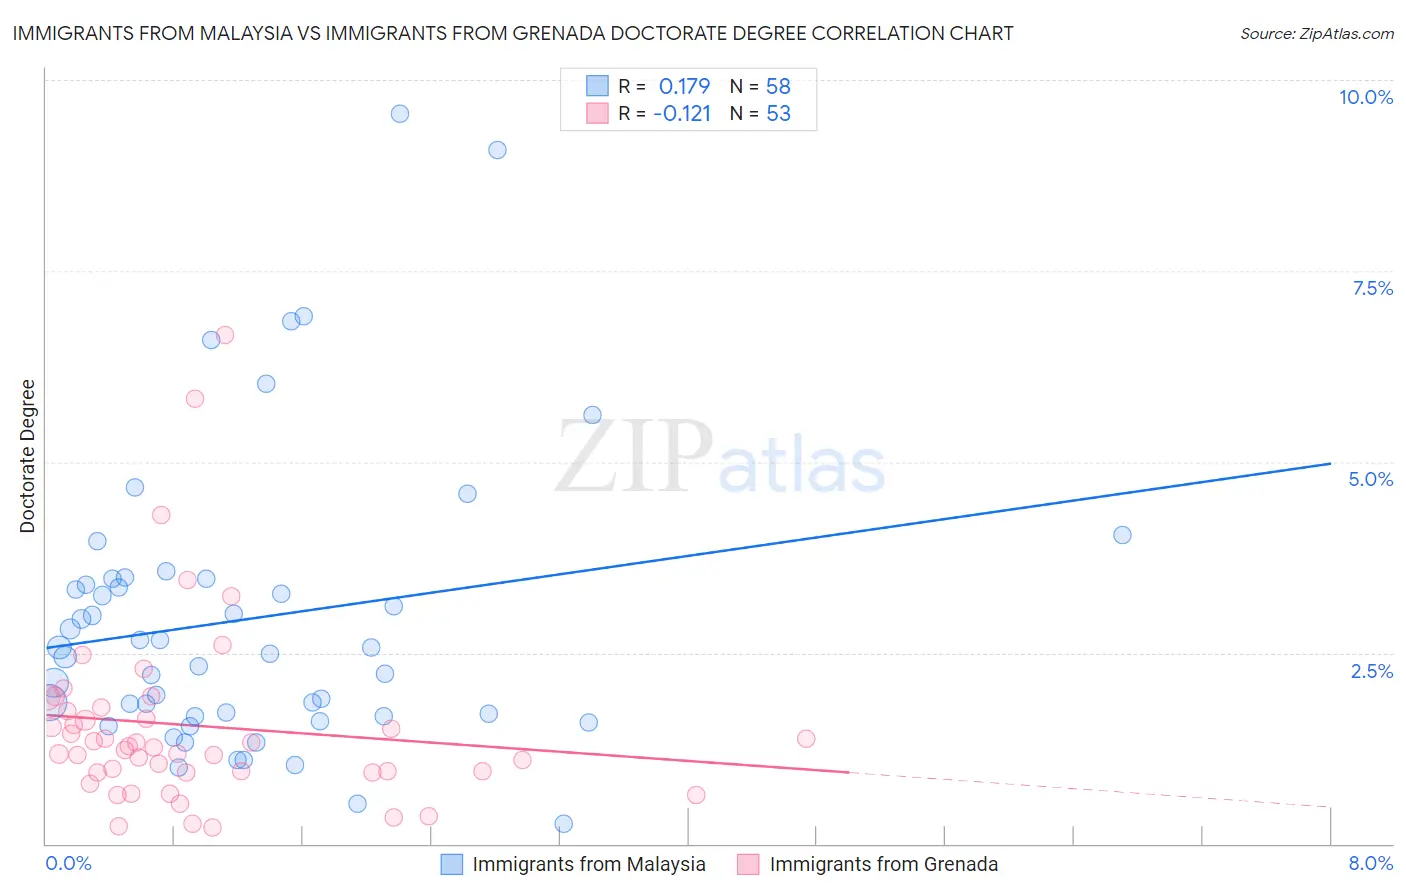
Immigrants from Malaysia vs Immigrants from Grenada Doctorate Degree Correlation Chart

The statistical analysis conducted on geographies consisting of 197,613,478 people shows a poor positive correlation between the proportion of Immigrants from Malaysia and percentage of population with at least doctorate degree education in the United States with a correlation coefficient (R) of 0.179 and weighted average of 2.6%. Similarly, the statistical analysis conducted on geographies consisting of 67,051,362 people shows a poor negative correlation between the proportion of Immigrants from Grenada and percentage of population with at least doctorate degree education in the United States with a correlation coefficient (R) of -0.121 and weighted average of 1.4%, a difference of 87.1%.
Immigrants from Malaysia vs Immigrants from Grenada Doctorate Degree

Doctorate Degree Correlation Summary

MeasurementImmigrants from MalaysiaImmigrants from Grenada
Minimum0.26%0.22%
Maximum9.6%6.7%
Range9.3%6.4%
Mean2.9%1.5%
Median2.5%1.3%
Interquartile 25% (IQ1)1.7%0.93%
Interquartile 75% (IQ3)3.5%1.8%
Interquartile Range (IQR)1.8%0.83%
Standard Deviation (Sample)1.9%1.2%
Standard Deviation (Population)1.9%1.2%

Similar Demographics by Doctorate Degree

Demographics Similar to Immigrants from Malaysia by Doctorate Degree

In terms of doctorate degree, the demographic groups most similar to Immigrants from Malaysia are Cypriot (2.6%, a difference of 0.060%), Immigrants from Spain (2.6%, a difference of 0.060%), Cambodian (2.6%, a difference of 0.17%), Immigrants from Kuwait (2.6%, a difference of 0.32%), and Immigrants from Northern Europe (2.6%, a difference of 0.35%).
DemographicsRating | RankDoctorate Degree
Burmese
100.0
/100
|
#28
Exceptional
2.6%
Immigrants | South Central Asia
100.0
/100
|
#29
Exceptional
2.6%
Immigrants | Korea
100.0
/100
|
#30
Exceptional
2.6%
Latvians
100.0
/100
|
#31
Exceptional
2.6%
Immigrants | Northern Europe
100.0
/100
|
#32
Exceptional
2.6%
Cambodians
100.0
/100
|
#33
Exceptional
2.6%
Cypriots
100.0
/100
|
#34
Exceptional
2.6%
Immigrants | Malaysia
100.0
/100
|
#35
Exceptional
2.6%
Immigrants | Spain
100.0
/100
|
#36
Exceptional
2.6%
Immigrants | Kuwait
100.0
/100
|
#37
Exceptional
2.6%
Russians
100.0
/100
|
#38
Exceptional
2.6%
Immigrants | Ireland
100.0
/100
|
#39
Exceptional
2.5%
Estonians
100.0
/100
|
#40
Exceptional
2.5%
Immigrants | Russia
100.0
/100
|
#41
Exceptional
2.5%
New Zealanders
100.0
/100
|
#42
Exceptional
2.5%

Demographics Similar to Immigrants from Grenada by Doctorate Degree

In terms of doctorate degree, the demographic groups most similar to Immigrants from Grenada are Immigrants from Jamaica (1.4%, a difference of 0.30%), Immigrants from Laos (1.4%, a difference of 0.41%), Cuban (1.4%, a difference of 0.46%), Immigrants from Honduras (1.4%, a difference of 0.47%), and Guyanese (1.4%, a difference of 0.71%).
DemographicsRating | RankDoctorate Degree
Shoshone
0.1
/100
|
#302
Tragic
1.4%
Immigrants | Dominica
0.1
/100
|
#303
Tragic
1.4%
Mexican American Indians
0.1
/100
|
#304
Tragic
1.4%
Pennsylvania Germans
0.1
/100
|
#305
Tragic
1.4%
Guyanese
0.1
/100
|
#306
Tragic
1.4%
Cubans
0.1
/100
|
#307
Tragic
1.4%
Immigrants | Laos
0.1
/100
|
#308
Tragic
1.4%
Immigrants | Grenada
0.1
/100
|
#309
Tragic
1.4%
Immigrants | Jamaica
0.1
/100
|
#310
Tragic
1.4%
Immigrants | Honduras
0.1
/100
|
#311
Tragic
1.4%
Immigrants | Nicaragua
0.1
/100
|
#312
Tragic
1.4%
Menominee
0.1
/100
|
#313
Tragic
1.4%
Dominicans
0.1
/100
|
#314
Tragic
1.4%
Immigrants | Azores
0.1
/100
|
#315
Tragic
1.4%
Navajo
0.1
/100
|
#316
Tragic
1.4%