Pakistani vs Immigrants from Grenada Female Poverty Among 25-34 Year Olds
COMPARE
Pakistani
Immigrants from Grenada
Female Poverty Among 25-34 Year Olds
Female Poverty Among 25-34 Year Olds Comparison
Pakistanis
Immigrants from Grenada
13.0%
FEMALE POVERTY AMONG 25-34 YEAR OLDS
88.4/ 100
METRIC RATING
131st/ 347
METRIC RANK
14.7%
FEMALE POVERTY AMONG 25-34 YEAR OLDS
1.3/ 100
METRIC RATING
240th/ 347
METRIC RANK
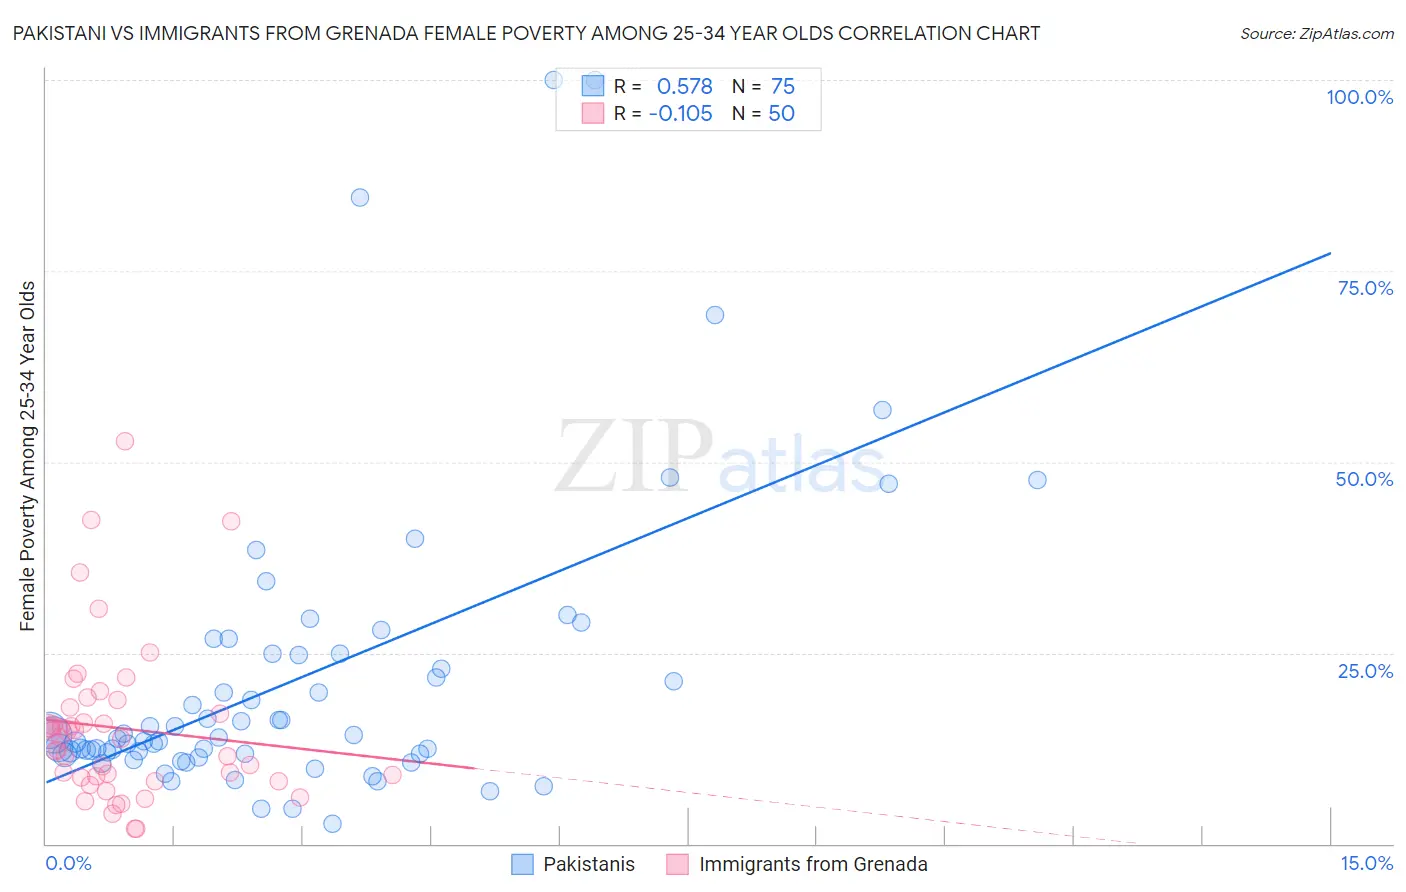
Pakistani vs Immigrants from Grenada Female Poverty Among 25-34 Year Olds Correlation Chart
The statistical analysis conducted on geographies consisting of 332,087,922 people shows a substantial positive correlation between the proportion of Pakistanis and poverty level among females between the ages 25 and 34 in the United States with a correlation coefficient (R) of 0.578 and weighted average of 13.0%. Similarly, the statistical analysis conducted on geographies consisting of 67,009,327 people shows a poor negative correlation between the proportion of Immigrants from Grenada and poverty level among females between the ages 25 and 34 in the United States with a correlation coefficient (R) of -0.105 and weighted average of 14.7%, a difference of 13.8%.
Female Poverty Among 25-34 Year Olds Correlation Summary
| Measurement | Pakistani | Immigrants from Grenada |
| Minimum | 2.6% | 1.9% |
| Maximum | 100.0% | 52.7% |
| Range | 97.4% | 50.8% |
| Mean | 21.5% | 15.1% |
| Median | 13.9% | 13.8% |
| Interquartile 25% (IQ1) | 11.8% | 8.6% |
| Interquartile 75% (IQ3) | 24.9% | 17.9% |
| Interquartile Range (IQR) | 13.1% | 9.3% |
| Standard Deviation (Sample) | 19.5% | 10.4% |
| Standard Deviation (Population) | 19.4% | 10.3% |
Similar Demographics by Female Poverty Among 25-34 Year Olds
Demographics Similar to Pakistanis by Female Poverty Among 25-34 Year Olds
In terms of female poverty among 25-34 year olds, the demographic groups most similar to Pakistanis are Immigrants from Hungary (13.0%, a difference of 0.020%), Serbian (13.0%, a difference of 0.15%), Immigrants from Uzbekistan (12.9%, a difference of 0.27%), Immigrants from North America (12.9%, a difference of 0.30%), and Syrian (12.9%, a difference of 0.42%).
| Demographics | Rating | Rank | Female Poverty Among 25-34 Year Olds |
| Immigrants | Netherlands | 92.0 /100 | #124 | Exceptional 12.8% |
| Immigrants | Canada | 91.5 /100 | #125 | Exceptional 12.9% |
| Immigrants | Fiji | 91.2 /100 | #126 | Exceptional 12.9% |
| Czechs | 90.3 /100 | #127 | Exceptional 12.9% |
| Syrians | 90.2 /100 | #128 | Exceptional 12.9% |
| Immigrants | North America | 89.7 /100 | #129 | Excellent 12.9% |
| Immigrants | Uzbekistan | 89.6 /100 | #130 | Excellent 12.9% |
| Pakistanis | 88.4 /100 | #131 | Excellent 13.0% |
| Immigrants | Hungary | 88.3 /100 | #132 | Excellent 13.0% |
| Serbians | 87.6 /100 | #133 | Excellent 13.0% |
| Afghans | 85.8 /100 | #134 | Excellent 13.0% |
| South Africans | 85.7 /100 | #135 | Excellent 13.0% |
| Immigrants | England | 85.5 /100 | #136 | Excellent 13.0% |
| Immigrants | Chile | 84.6 /100 | #137 | Excellent 13.1% |
| Brazilians | 84.5 /100 | #138 | Excellent 13.1% |
Demographics Similar to Immigrants from Grenada by Female Poverty Among 25-34 Year Olds
In terms of female poverty among 25-34 year olds, the demographic groups most similar to Immigrants from Grenada are Malaysian (14.7%, a difference of 0.050%), Alsatian (14.7%, a difference of 0.080%), Salvadoran (14.7%, a difference of 0.12%), Immigrants from Ghana (14.7%, a difference of 0.12%), and Immigrants from Jamaica (14.7%, a difference of 0.14%).
| Demographics | Rating | Rank | Female Poverty Among 25-34 Year Olds |
| Whites/Caucasians | 1.8 /100 | #233 | Tragic 14.7% |
| Cubans | 1.6 /100 | #234 | Tragic 14.7% |
| Immigrants | Jamaica | 1.4 /100 | #235 | Tragic 14.7% |
| Salvadorans | 1.4 /100 | #236 | Tragic 14.7% |
| Immigrants | Ghana | 1.4 /100 | #237 | Tragic 14.7% |
| Alsatians | 1.4 /100 | #238 | Tragic 14.7% |
| Malaysians | 1.4 /100 | #239 | Tragic 14.7% |
| Immigrants | Grenada | 1.3 /100 | #240 | Tragic 14.7% |
| Scotch-Irish | 1.2 /100 | #241 | Tragic 14.8% |
| Barbadians | 1.2 /100 | #242 | Tragic 14.8% |
| Immigrants | Nicaragua | 1.1 /100 | #243 | Tragic 14.8% |
| Immigrants | Bangladesh | 1.1 /100 | #244 | Tragic 14.8% |
| Immigrants | Middle Africa | 1.0 /100 | #245 | Tragic 14.8% |
| Jamaicans | 1.0 /100 | #246 | Tragic 14.8% |
| German Russians | 0.8 /100 | #247 | Tragic 14.9% |