Pakistani vs Immigrants from Grenada Householder Income Ages 45 - 64 years
COMPARE
Pakistani
Immigrants from Grenada
Householder Income Ages 45 - 64 years
Householder Income Ages 45 - 64 years Comparison
Pakistanis
Immigrants from Grenada
$105,317
HOUSEHOLDER INCOME AGES 45 - 64 YEARS
92.4/ 100
METRIC RATING
125th/ 347
METRIC RANK
$85,552
HOUSEHOLDER INCOME AGES 45 - 64 YEARS
0.1/ 100
METRIC RATING
295th/ 347
METRIC RANK
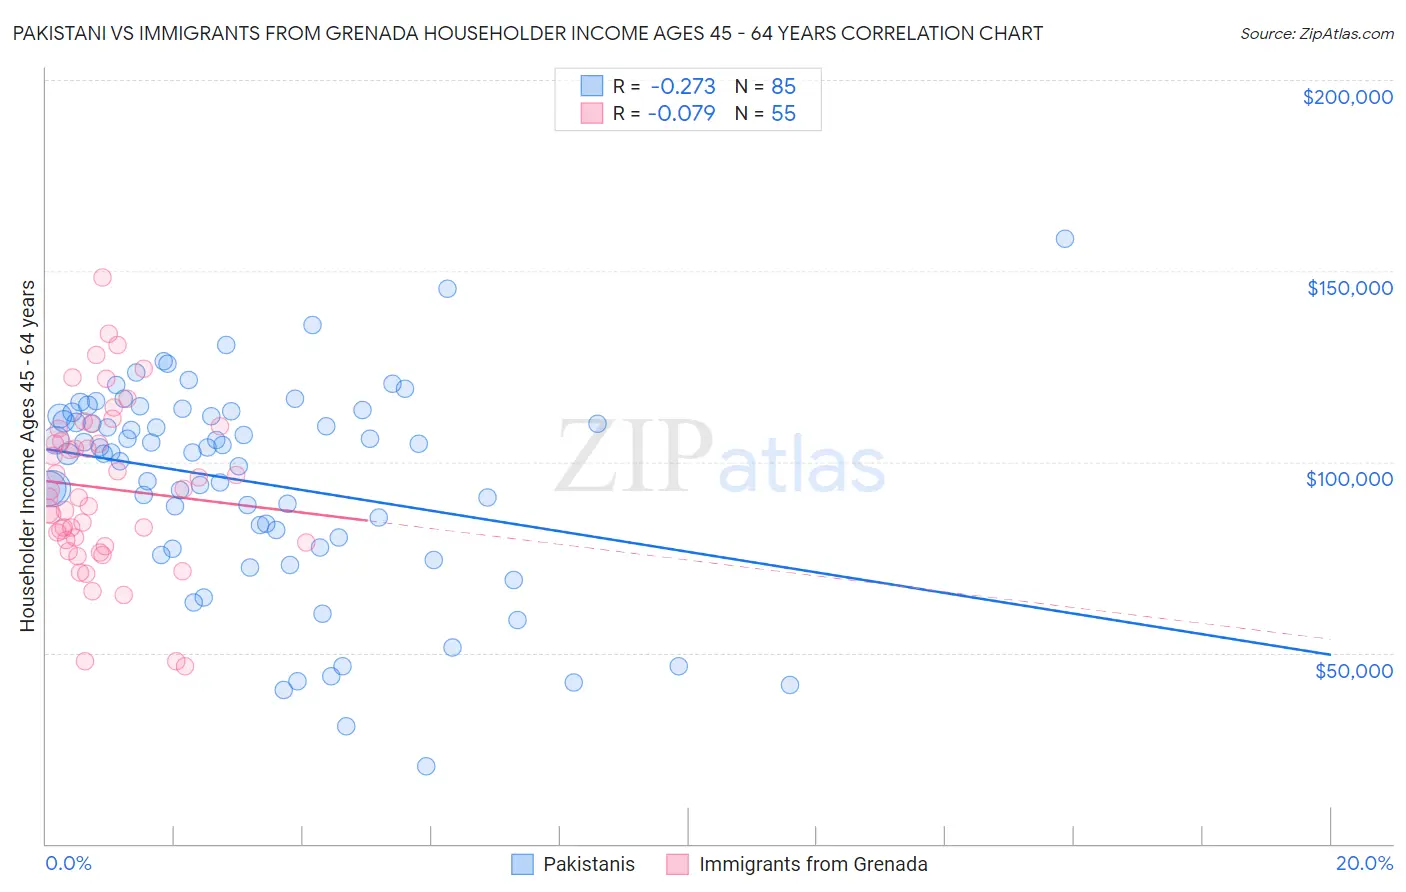
Pakistani vs Immigrants from Grenada Householder Income Ages 45 - 64 years Correlation Chart
The statistical analysis conducted on geographies consisting of 334,898,404 people shows a weak negative correlation between the proportion of Pakistanis and household income with householder between the ages 45 and 64 in the United States with a correlation coefficient (R) of -0.273 and weighted average of $105,317. Similarly, the statistical analysis conducted on geographies consisting of 67,175,109 people shows a slight negative correlation between the proportion of Immigrants from Grenada and household income with householder between the ages 45 and 64 in the United States with a correlation coefficient (R) of -0.079 and weighted average of $85,552, a difference of 23.1%.
Householder Income Ages 45 - 64 years Correlation Summary
| Measurement | Pakistani | Immigrants from Grenada |
| Minimum | $20,167 | $46,607 |
| Maximum | $158,417 | $148,164 |
| Range | $138,250 | $101,557 |
| Mean | $94,559 | $93,124 |
| Median | $102,574 | $90,758 |
| Interquartile 25% (IQ1) | $78,855 | $78,920 |
| Interquartile 75% (IQ3) | $112,512 | $108,561 |
| Interquartile Range (IQR) | $33,657 | $29,641 |
| Standard Deviation (Sample) | $26,997 | $21,622 |
| Standard Deviation (Population) | $26,838 | $21,425 |
Similar Demographics by Householder Income Ages 45 - 64 years
Demographics Similar to Pakistanis by Householder Income Ages 45 - 64 years
In terms of householder income ages 45 - 64 years, the demographic groups most similar to Pakistanis are Portuguese ($105,309, a difference of 0.010%), Immigrants from Saudi Arabia ($105,249, a difference of 0.060%), Immigrants from Northern Africa ($105,430, a difference of 0.11%), Native Hawaiian ($105,149, a difference of 0.16%), and Peruvian ($105,070, a difference of 0.23%).
| Demographics | Rating | Rank | Householder Income Ages 45 - 64 years |
| Immigrants | Western Asia | 95.0 /100 | #118 | Exceptional $106,217 |
| Immigrants | Jordan | 94.9 /100 | #119 | Exceptional $106,164 |
| Immigrants | South Eastern Asia | 94.8 /100 | #120 | Exceptional $106,109 |
| Poles | 94.4 /100 | #121 | Exceptional $105,952 |
| Immigrants | North Macedonia | 94.2 /100 | #122 | Exceptional $105,892 |
| Danes | 93.4 /100 | #123 | Exceptional $105,619 |
| Immigrants | Northern Africa | 92.8 /100 | #124 | Exceptional $105,430 |
| Pakistanis | 92.4 /100 | #125 | Exceptional $105,317 |
| Portuguese | 92.4 /100 | #126 | Exceptional $105,309 |
| Immigrants | Saudi Arabia | 92.2 /100 | #127 | Exceptional $105,249 |
| Native Hawaiians | 91.8 /100 | #128 | Exceptional $105,149 |
| Peruvians | 91.5 /100 | #129 | Exceptional $105,070 |
| Immigrants | Zimbabwe | 91.2 /100 | #130 | Exceptional $104,992 |
| Immigrants | Syria | 90.7 /100 | #131 | Exceptional $104,858 |
| Lebanese | 90.1 /100 | #132 | Exceptional $104,734 |
Demographics Similar to Immigrants from Grenada by Householder Income Ages 45 - 64 years
In terms of householder income ages 45 - 64 years, the demographic groups most similar to Immigrants from Grenada are British West Indian ($85,571, a difference of 0.020%), Comanche ($85,787, a difference of 0.27%), Immigrants from Zaire ($85,207, a difference of 0.40%), Fijian ($85,187, a difference of 0.43%), and Immigrants from Central America ($85,965, a difference of 0.48%).
| Demographics | Rating | Rank | Householder Income Ages 45 - 64 years |
| Immigrants | St. Vincent and the Grenadines | 0.1 /100 | #288 | Tragic $86,394 |
| Cubans | 0.1 /100 | #289 | Tragic $86,301 |
| Cherokee | 0.1 /100 | #290 | Tragic $86,125 |
| Hispanics or Latinos | 0.1 /100 | #291 | Tragic $86,006 |
| Immigrants | Central America | 0.1 /100 | #292 | Tragic $85,965 |
| Comanche | 0.1 /100 | #293 | Tragic $85,787 |
| British West Indians | 0.1 /100 | #294 | Tragic $85,571 |
| Immigrants | Grenada | 0.1 /100 | #295 | Tragic $85,552 |
| Immigrants | Zaire | 0.1 /100 | #296 | Tragic $85,207 |
| Fijians | 0.1 /100 | #297 | Tragic $85,187 |
| Africans | 0.0 /100 | #298 | Tragic $84,925 |
| Immigrants | Mexico | 0.0 /100 | #299 | Tragic $84,910 |
| Indonesians | 0.0 /100 | #300 | Tragic $84,890 |
| Potawatomi | 0.0 /100 | #301 | Tragic $84,613 |
| Haitians | 0.0 /100 | #302 | Tragic $84,384 |