Soviet Union vs Immigrants from Panama 10th Grade
COMPARE
Soviet Union
Immigrants from Panama
10th Grade
10th Grade Comparison
Soviet Union
Immigrants from Panama
94.6%
10TH GRADE
98.3/ 100
METRIC RATING
93rd/ 347
METRIC RANK
93.1%
10TH GRADE
4.3/ 100
METRIC RATING
237th/ 347
METRIC RANK
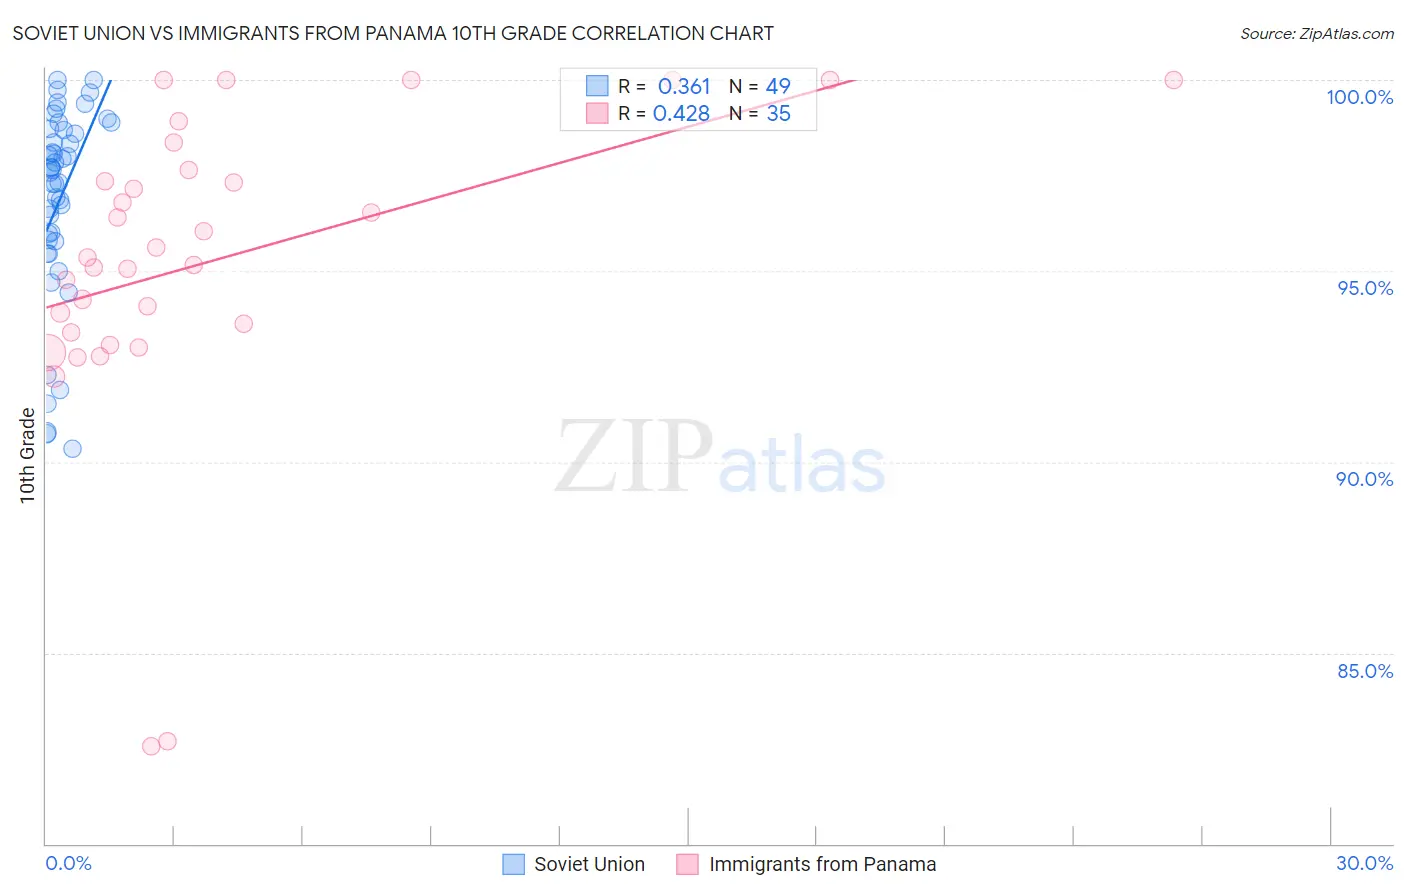
Soviet Union vs Immigrants from Panama 10th Grade Correlation Chart
The statistical analysis conducted on geographies consisting of 43,454,395 people shows a mild positive correlation between the proportion of Soviet Union and percentage of population with at least 10th grade education in the United States with a correlation coefficient (R) of 0.361 and weighted average of 94.6%. Similarly, the statistical analysis conducted on geographies consisting of 221,183,192 people shows a moderate positive correlation between the proportion of Immigrants from Panama and percentage of population with at least 10th grade education in the United States with a correlation coefficient (R) of 0.428 and weighted average of 93.1%, a difference of 1.6%.
10th Grade Correlation Summary
| Measurement | Soviet Union | Immigrants from Panama |
| Minimum | 90.4% | 82.6% |
| Maximum | 100.0% | 100.0% |
| Range | 9.6% | 17.4% |
| Mean | 96.9% | 95.3% |
| Median | 97.7% | 95.4% |
| Interquartile 25% (IQ1) | 95.8% | 93.4% |
| Interquartile 75% (IQ3) | 98.7% | 97.6% |
| Interquartile Range (IQR) | 2.9% | 4.3% |
| Standard Deviation (Sample) | 2.5% | 4.0% |
| Standard Deviation (Population) | 2.5% | 4.0% |
Similar Demographics by 10th Grade
Demographics Similar to Soviet Union by 10th Grade
In terms of 10th grade, the demographic groups most similar to Soviet Union are Immigrants from Germany (94.6%, a difference of 0.0%), Yugoslavian (94.6%, a difference of 0.010%), Menominee (94.6%, a difference of 0.010%), Immigrants from Switzerland (94.6%, a difference of 0.010%), and Lebanese (94.6%, a difference of 0.010%).
| Demographics | Rating | Rank | 10th Grade |
| Puget Sound Salish | 99.0 /100 | #86 | Exceptional 94.7% |
| Immigrants | Saudi Arabia | 99.0 /100 | #87 | Exceptional 94.7% |
| Immigrants | Japan | 99.0 /100 | #88 | Exceptional 94.7% |
| Immigrants | Moldova | 98.9 /100 | #89 | Exceptional 94.7% |
| South Africans | 98.8 /100 | #90 | Exceptional 94.7% |
| Whites/Caucasians | 98.8 /100 | #91 | Exceptional 94.7% |
| Yugoslavians | 98.4 /100 | #92 | Exceptional 94.6% |
| Soviet Union | 98.3 /100 | #93 | Exceptional 94.6% |
| Immigrants | Germany | 98.3 /100 | #94 | Exceptional 94.6% |
| Menominee | 98.3 /100 | #95 | Exceptional 94.6% |
| Immigrants | Switzerland | 98.3 /100 | #96 | Exceptional 94.6% |
| Lebanese | 98.3 /100 | #97 | Exceptional 94.6% |
| Immigrants | Bulgaria | 98.1 /100 | #98 | Exceptional 94.6% |
| Immigrants | France | 97.9 /100 | #99 | Exceptional 94.5% |
| Immigrants | South Central Asia | 97.8 /100 | #100 | Exceptional 94.5% |
Demographics Similar to Immigrants from Panama by 10th Grade
In terms of 10th grade, the demographic groups most similar to Immigrants from Panama are African (93.1%, a difference of 0.010%), Afghan (93.1%, a difference of 0.010%), Nigerian (93.1%, a difference of 0.010%), Costa Rican (93.1%, a difference of 0.010%), and Immigrants from Hong Kong (93.1%, a difference of 0.010%).
| Demographics | Rating | Rank | 10th Grade |
| Immigrants | Africa | 5.0 /100 | #230 | Tragic 93.1% |
| South American Indians | 4.9 /100 | #231 | Tragic 93.1% |
| Bahamians | 4.9 /100 | #232 | Tragic 93.1% |
| Comanche | 4.9 /100 | #233 | Tragic 93.1% |
| Sub-Saharan Africans | 4.7 /100 | #234 | Tragic 93.1% |
| Africans | 4.6 /100 | #235 | Tragic 93.1% |
| Afghans | 4.5 /100 | #236 | Tragic 93.1% |
| Immigrants | Panama | 4.3 /100 | #237 | Tragic 93.1% |
| Nigerians | 4.2 /100 | #238 | Tragic 93.1% |
| Costa Ricans | 4.2 /100 | #239 | Tragic 93.1% |
| Immigrants | Hong Kong | 4.2 /100 | #240 | Tragic 93.1% |
| Immigrants | Somalia | 2.7 /100 | #241 | Tragic 93.0% |
| Immigrants | Cameroon | 2.6 /100 | #242 | Tragic 93.0% |
| Senegalese | 2.4 /100 | #243 | Tragic 93.0% |
| Spanish Americans | 2.1 /100 | #244 | Tragic 92.9% |