Macedonian vs Immigrants from Middle Africa 10th Grade
COMPARE
Macedonian
Immigrants from Middle Africa
10th Grade
10th Grade Comparison
Macedonians
Immigrants from Middle Africa
95.2%
10TH GRADE
99.9/ 100
METRIC RATING
43rd/ 347
METRIC RANK
92.9%
10TH GRADE
1.7/ 100
METRIC RATING
246th/ 347
METRIC RANK
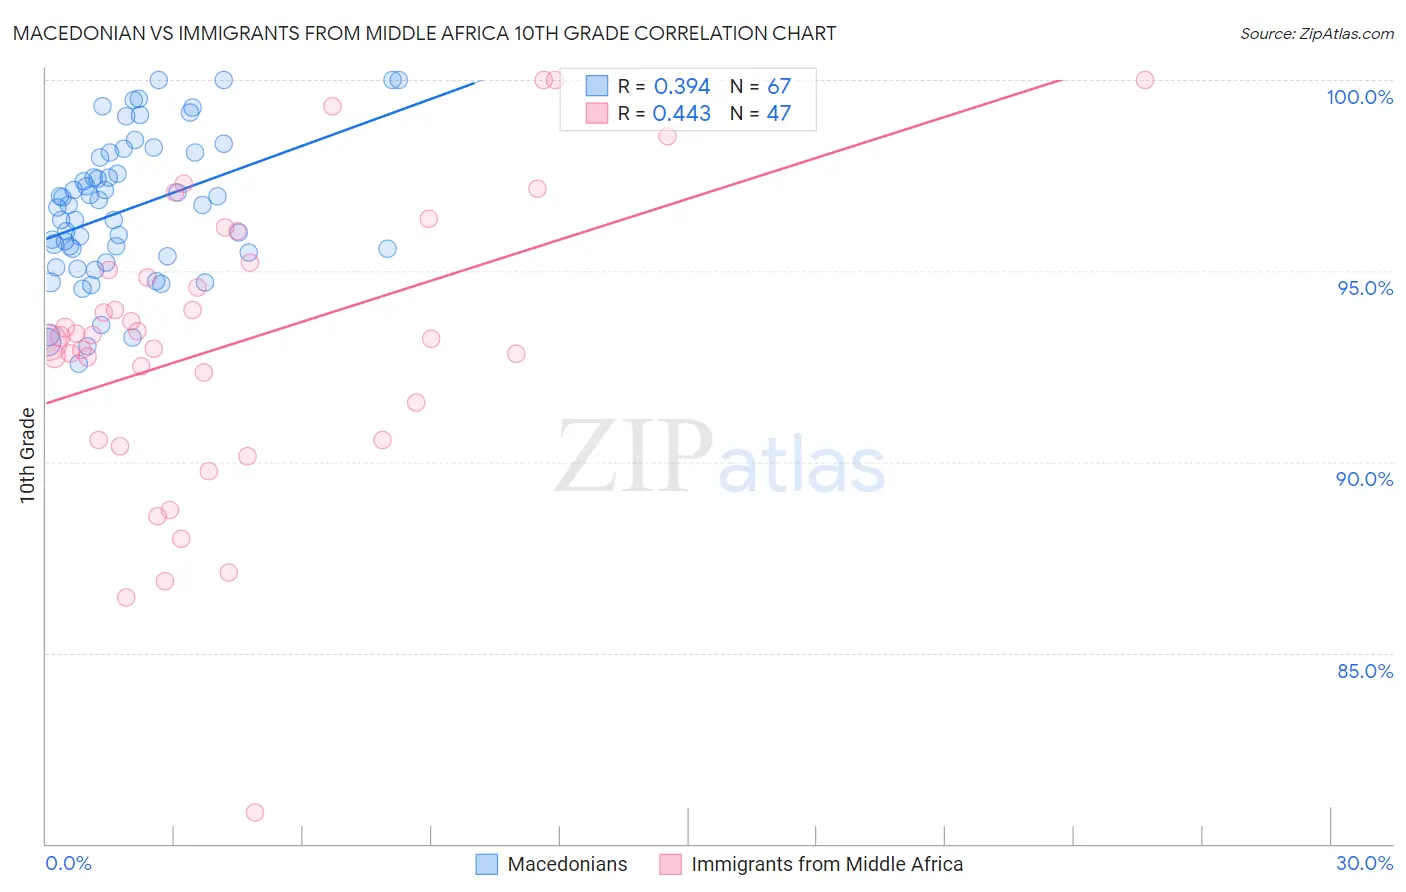
Macedonian vs Immigrants from Middle Africa 10th Grade Correlation Chart
The statistical analysis conducted on geographies consisting of 132,581,663 people shows a mild positive correlation between the proportion of Macedonians and percentage of population with at least 10th grade education in the United States with a correlation coefficient (R) of 0.394 and weighted average of 95.2%. Similarly, the statistical analysis conducted on geographies consisting of 202,726,551 people shows a moderate positive correlation between the proportion of Immigrants from Middle Africa and percentage of population with at least 10th grade education in the United States with a correlation coefficient (R) of 0.443 and weighted average of 92.9%, a difference of 2.5%.
10th Grade Correlation Summary
| Measurement | Macedonian | Immigrants from Middle Africa |
| Minimum | 92.6% | 80.8% |
| Maximum | 100.0% | 100.0% |
| Range | 7.4% | 19.2% |
| Mean | 96.6% | 93.1% |
| Median | 96.7% | 93.3% |
| Interquartile 25% (IQ1) | 95.4% | 90.6% |
| Interquartile 75% (IQ3) | 98.1% | 95.2% |
| Interquartile Range (IQR) | 2.7% | 4.6% |
| Standard Deviation (Sample) | 1.9% | 3.9% |
| Standard Deviation (Population) | 1.9% | 3.8% |
Similar Demographics by 10th Grade
Demographics Similar to Macedonians by 10th Grade
In terms of 10th grade, the demographic groups most similar to Macedonians are Immigrants from Northern Europe (95.2%, a difference of 0.010%), Greek (95.2%, a difference of 0.010%), Slavic (95.2%, a difference of 0.020%), Czechoslovakian (95.1%, a difference of 0.020%), and Serbian (95.1%, a difference of 0.030%).
| Demographics | Rating | Rank | 10th Grade |
| Immigrants | India | 99.9 /100 | #36 | Exceptional 95.3% |
| French Canadians | 99.9 /100 | #37 | Exceptional 95.3% |
| Northern Europeans | 99.9 /100 | #38 | Exceptional 95.3% |
| Immigrants | Scotland | 99.9 /100 | #39 | Exceptional 95.2% |
| Scotch-Irish | 99.9 /100 | #40 | Exceptional 95.2% |
| Russians | 99.9 /100 | #41 | Exceptional 95.2% |
| Slavs | 99.9 /100 | #42 | Exceptional 95.2% |
| Macedonians | 99.9 /100 | #43 | Exceptional 95.2% |
| Immigrants | Northern Europe | 99.9 /100 | #44 | Exceptional 95.2% |
| Greeks | 99.9 /100 | #45 | Exceptional 95.2% |
| Czechoslovakians | 99.9 /100 | #46 | Exceptional 95.1% |
| Serbians | 99.9 /100 | #47 | Exceptional 95.1% |
| Australians | 99.9 /100 | #48 | Exceptional 95.1% |
| Immigrants | Austria | 99.9 /100 | #49 | Exceptional 95.1% |
| Immigrants | Canada | 99.8 /100 | #50 | Exceptional 95.1% |
Demographics Similar to Immigrants from Middle Africa by 10th Grade
In terms of 10th grade, the demographic groups most similar to Immigrants from Middle Africa are Uruguayan (92.9%, a difference of 0.020%), Immigrants from Afghanistan (92.8%, a difference of 0.040%), Spanish American (92.9%, a difference of 0.050%), Colombian (92.8%, a difference of 0.050%), and Immigrants from Senegal (92.8%, a difference of 0.050%).
| Demographics | Rating | Rank | 10th Grade |
| Costa Ricans | 4.2 /100 | #239 | Tragic 93.1% |
| Immigrants | Hong Kong | 4.2 /100 | #240 | Tragic 93.1% |
| Immigrants | Somalia | 2.7 /100 | #241 | Tragic 93.0% |
| Immigrants | Cameroon | 2.6 /100 | #242 | Tragic 93.0% |
| Senegalese | 2.4 /100 | #243 | Tragic 93.0% |
| Spanish Americans | 2.1 /100 | #244 | Tragic 92.9% |
| Uruguayans | 1.8 /100 | #245 | Tragic 92.9% |
| Immigrants | Middle Africa | 1.7 /100 | #246 | Tragic 92.9% |
| Immigrants | Afghanistan | 1.4 /100 | #247 | Tragic 92.8% |
| Colombians | 1.4 /100 | #248 | Tragic 92.8% |
| Immigrants | Senegal | 1.4 /100 | #249 | Tragic 92.8% |
| Jamaicans | 1.2 /100 | #250 | Tragic 92.8% |
| Immigrants | Thailand | 1.0 /100 | #251 | Tragic 92.8% |
| South Americans | 0.9 /100 | #252 | Tragic 92.8% |
| Ghanaians | 0.9 /100 | #253 | Tragic 92.8% |