Paiute vs Immigrants from Middle Africa Female Poverty Among 25-34 Year Olds
COMPARE
Paiute
Immigrants from Middle Africa
Female Poverty Among 25-34 Year Olds
Female Poverty Among 25-34 Year Olds Comparison
Paiute
Immigrants from Middle Africa
19.6%
FEMALE POVERTY AMONG 25-34 YEAR OLDS
0.0/ 100
METRIC RATING
330th/ 347
METRIC RANK
14.8%
FEMALE POVERTY AMONG 25-34 YEAR OLDS
1.0/ 100
METRIC RATING
245th/ 347
METRIC RANK
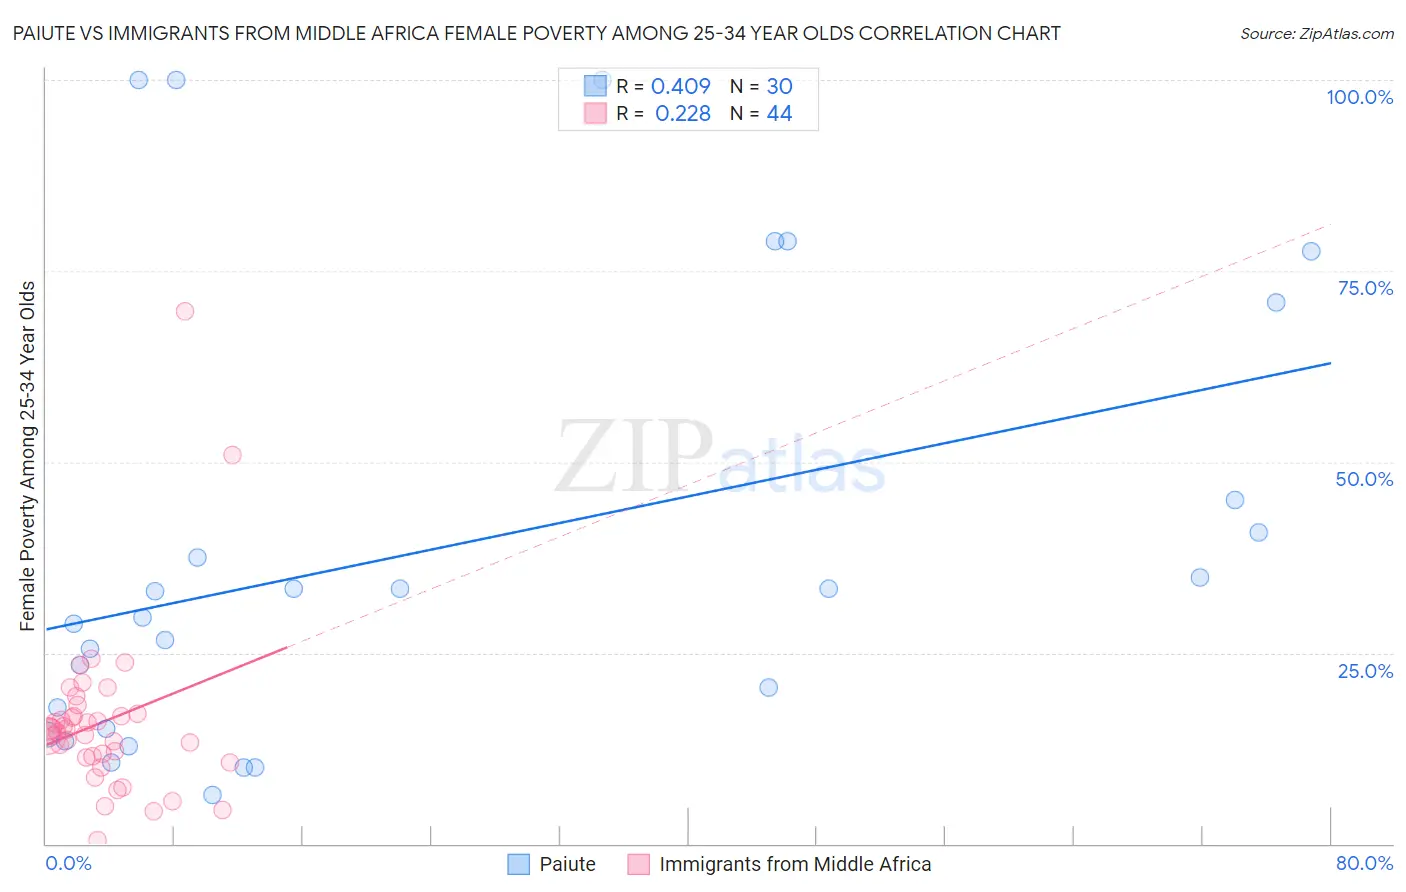
Paiute vs Immigrants from Middle Africa Female Poverty Among 25-34 Year Olds Correlation Chart
The statistical analysis conducted on geographies consisting of 58,229,271 people shows a moderate positive correlation between the proportion of Paiute and poverty level among females between the ages 25 and 34 in the United States with a correlation coefficient (R) of 0.409 and weighted average of 19.6%. Similarly, the statistical analysis conducted on geographies consisting of 201,471,968 people shows a weak positive correlation between the proportion of Immigrants from Middle Africa and poverty level among females between the ages 25 and 34 in the United States with a correlation coefficient (R) of 0.228 and weighted average of 14.8%, a difference of 32.2%.
Female Poverty Among 25-34 Year Olds Correlation Summary
| Measurement | Paiute | Immigrants from Middle Africa |
| Minimum | 6.4% | 0.42% |
| Maximum | 100.0% | 69.6% |
| Range | 93.6% | 69.2% |
| Mean | 38.7% | 16.0% |
| Median | 31.4% | 14.8% |
| Interquartile 25% (IQ1) | 15.1% | 11.4% |
| Interquartile 75% (IQ3) | 45.1% | 16.8% |
| Interquartile Range (IQR) | 30.0% | 5.5% |
| Standard Deviation (Sample) | 29.2% | 11.3% |
| Standard Deviation (Population) | 28.7% | 11.2% |
Similar Demographics by Female Poverty Among 25-34 Year Olds
Demographics Similar to Paiute by Female Poverty Among 25-34 Year Olds
In terms of female poverty among 25-34 year olds, the demographic groups most similar to Paiute are Kiowa (19.7%, a difference of 0.42%), Immigrants from Yemen (19.8%, a difference of 1.0%), Cajun (19.9%, a difference of 1.8%), Creek (19.2%, a difference of 2.2%), and Alaskan Athabascan (19.1%, a difference of 2.5%).
| Demographics | Rating | Rank | Female Poverty Among 25-34 Year Olds |
| Seminole | 0.0 /100 | #323 | Tragic 18.3% |
| Dutch West Indians | 0.0 /100 | #324 | Tragic 18.4% |
| Inupiat | 0.0 /100 | #325 | Tragic 18.5% |
| Blacks/African Americans | 0.0 /100 | #326 | Tragic 18.9% |
| Cheyenne | 0.0 /100 | #327 | Tragic 19.1% |
| Alaskan Athabascans | 0.0 /100 | #328 | Tragic 19.1% |
| Creek | 0.0 /100 | #329 | Tragic 19.2% |
| Paiute | 0.0 /100 | #330 | Tragic 19.6% |
| Kiowa | 0.0 /100 | #331 | Tragic 19.7% |
| Immigrants | Yemen | 0.0 /100 | #332 | Tragic 19.8% |
| Cajuns | 0.0 /100 | #333 | Tragic 19.9% |
| Apache | 0.0 /100 | #334 | Tragic 20.1% |
| Natives/Alaskans | 0.0 /100 | #335 | Tragic 20.3% |
| Pueblo | 0.0 /100 | #336 | Tragic 22.2% |
| Crow | 0.0 /100 | #337 | Tragic 22.7% |
Demographics Similar to Immigrants from Middle Africa by Female Poverty Among 25-34 Year Olds
In terms of female poverty among 25-34 year olds, the demographic groups most similar to Immigrants from Middle Africa are Jamaican (14.8%, a difference of 0.040%), Immigrants from Bangladesh (14.8%, a difference of 0.18%), Immigrants from Nicaragua (14.8%, a difference of 0.19%), Scotch-Irish (14.8%, a difference of 0.22%), and Barbadian (14.8%, a difference of 0.22%).
| Demographics | Rating | Rank | Female Poverty Among 25-34 Year Olds |
| Alsatians | 1.4 /100 | #238 | Tragic 14.7% |
| Malaysians | 1.4 /100 | #239 | Tragic 14.7% |
| Immigrants | Grenada | 1.3 /100 | #240 | Tragic 14.7% |
| Scotch-Irish | 1.2 /100 | #241 | Tragic 14.8% |
| Barbadians | 1.2 /100 | #242 | Tragic 14.8% |
| Immigrants | Nicaragua | 1.1 /100 | #243 | Tragic 14.8% |
| Immigrants | Bangladesh | 1.1 /100 | #244 | Tragic 14.8% |
| Immigrants | Middle Africa | 1.0 /100 | #245 | Tragic 14.8% |
| Jamaicans | 1.0 /100 | #246 | Tragic 14.8% |
| German Russians | 0.8 /100 | #247 | Tragic 14.9% |
| Immigrants | Western Africa | 0.8 /100 | #248 | Tragic 14.9% |
| Immigrants | Haiti | 0.5 /100 | #249 | Tragic 15.0% |
| Immigrants | El Salvador | 0.5 /100 | #250 | Tragic 15.0% |
| Haitians | 0.5 /100 | #251 | Tragic 15.0% |
| Belizeans | 0.4 /100 | #252 | Tragic 15.1% |