Immigrants from Austria vs Immigrants from Canada Professional Degree
COMPARE
Immigrants from Austria
Immigrants from Canada
Professional Degree
Professional Degree Comparison
Immigrants from Austria
Immigrants from Canada
6.0%
PROFESSIONAL DEGREE
100.0/ 100
METRIC RATING
37th/ 347
METRIC RANK
5.3%
PROFESSIONAL DEGREE
99.7/ 100
METRIC RATING
76th/ 347
METRIC RANK
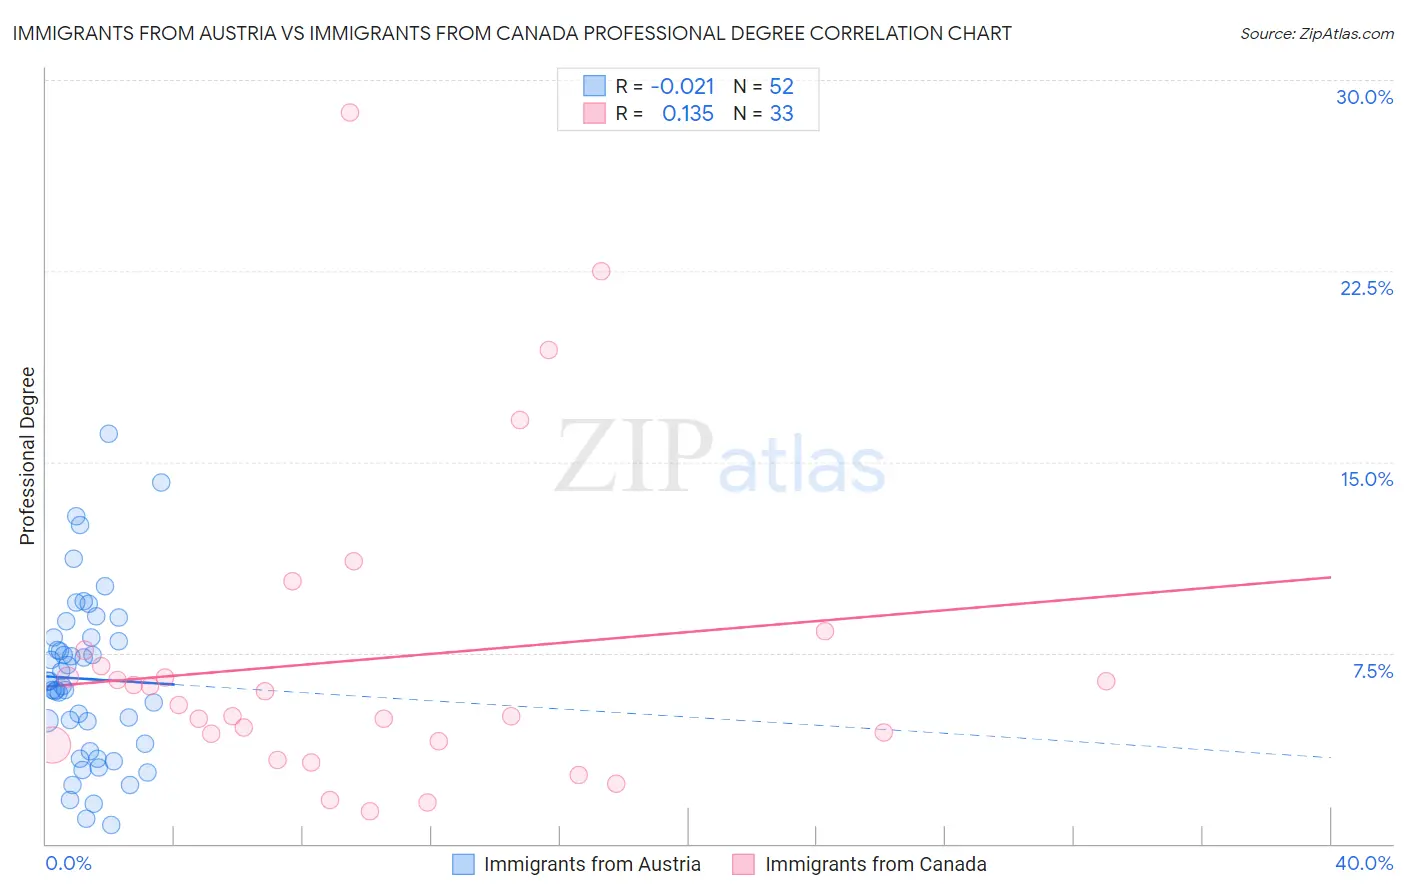
Immigrants from Austria vs Immigrants from Canada Professional Degree Correlation Chart
The statistical analysis conducted on geographies consisting of 167,912,662 people shows no correlation between the proportion of Immigrants from Austria and percentage of population with at least professional degree education in the United States with a correlation coefficient (R) of -0.021 and weighted average of 6.0%. Similarly, the statistical analysis conducted on geographies consisting of 457,915,451 people shows a poor positive correlation between the proportion of Immigrants from Canada and percentage of population with at least professional degree education in the United States with a correlation coefficient (R) of 0.135 and weighted average of 5.3%, a difference of 12.7%.
Professional Degree Correlation Summary
| Measurement | Immigrants from Austria | Immigrants from Canada |
| Minimum | 0.74% | 1.3% |
| Maximum | 16.1% | 28.7% |
| Range | 15.3% | 27.4% |
| Mean | 6.5% | 7.2% |
| Median | 6.3% | 5.5% |
| Interquartile 25% (IQ1) | 3.8% | 4.0% |
| Interquartile 75% (IQ3) | 8.1% | 7.3% |
| Interquartile Range (IQR) | 4.4% | 3.3% |
| Standard Deviation (Sample) | 3.3% | 6.1% |
| Standard Deviation (Population) | 3.3% | 6.0% |
Similar Demographics by Professional Degree
Demographics Similar to Immigrants from Austria by Professional Degree
In terms of professional degree, the demographic groups most similar to Immigrants from Austria are Immigrants from Norway (6.0%, a difference of 0.20%), Immigrants from Russia (6.0%, a difference of 0.32%), Immigrants from South Africa (6.0%, a difference of 0.45%), Cambodian (6.0%, a difference of 0.92%), and New Zealander (6.0%, a difference of 1.1%).
| Demographics | Rating | Rank | Professional Degree |
| Immigrants | Turkey | 100.0 /100 | #30 | Exceptional 6.2% |
| Immigrants | India | 100.0 /100 | #31 | Exceptional 6.2% |
| Thais | 100.0 /100 | #32 | Exceptional 6.1% |
| Burmese | 100.0 /100 | #33 | Exceptional 6.1% |
| Mongolians | 100.0 /100 | #34 | Exceptional 6.1% |
| Immigrants | Korea | 100.0 /100 | #35 | Exceptional 6.1% |
| Immigrants | Russia | 100.0 /100 | #36 | Exceptional 6.0% |
| Immigrants | Austria | 100.0 /100 | #37 | Exceptional 6.0% |
| Immigrants | Norway | 100.0 /100 | #38 | Exceptional 6.0% |
| Immigrants | South Africa | 100.0 /100 | #39 | Exceptional 6.0% |
| Cambodians | 100.0 /100 | #40 | Exceptional 6.0% |
| New Zealanders | 100.0 /100 | #41 | Exceptional 6.0% |
| Estonians | 100.0 /100 | #42 | Exceptional 6.0% |
| Immigrants | Saudi Arabia | 100.0 /100 | #43 | Exceptional 5.9% |
| Argentineans | 100.0 /100 | #44 | Exceptional 5.9% |
Demographics Similar to Immigrants from Canada by Professional Degree
In terms of professional degree, the demographic groups most similar to Immigrants from Canada are Immigrants from Ethiopia (5.3%, a difference of 0.040%), Immigrants from Indonesia (5.3%, a difference of 0.090%), Armenian (5.3%, a difference of 0.090%), Ethiopian (5.4%, a difference of 0.22%), and Immigrants from North America (5.3%, a difference of 0.26%).
| Demographics | Rating | Rank | Professional Degree |
| Immigrants | Hungary | 99.9 /100 | #69 | Exceptional 5.5% |
| Bhutanese | 99.8 /100 | #70 | Exceptional 5.4% |
| Immigrants | Western Asia | 99.8 /100 | #71 | Exceptional 5.4% |
| Lithuanians | 99.8 /100 | #72 | Exceptional 5.4% |
| Immigrants | Romania | 99.8 /100 | #73 | Exceptional 5.4% |
| Ethiopians | 99.7 /100 | #74 | Exceptional 5.4% |
| Immigrants | Indonesia | 99.7 /100 | #75 | Exceptional 5.3% |
| Immigrants | Canada | 99.7 /100 | #76 | Exceptional 5.3% |
| Immigrants | Ethiopia | 99.7 /100 | #77 | Exceptional 5.3% |
| Armenians | 99.7 /100 | #78 | Exceptional 5.3% |
| Immigrants | North America | 99.7 /100 | #79 | Exceptional 5.3% |
| Immigrants | England | 99.6 /100 | #80 | Exceptional 5.3% |
| Immigrants | Brazil | 99.6 /100 | #81 | Exceptional 5.3% |
| Romanians | 99.6 /100 | #82 | Exceptional 5.3% |
| Carpatho Rusyns | 99.6 /100 | #83 | Exceptional 5.3% |