Paiute vs Immigrants from Canada Hearing Disability
COMPARE
Paiute
Immigrants from Canada
Hearing Disability
Hearing Disability Comparison
Paiute
Immigrants from Canada
4.1%
HEARING DISABILITY
0.0/ 100
METRIC RATING
321st/ 347
METRIC RANK
3.5%
HEARING DISABILITY
0.1/ 100
METRIC RATING
263rd/ 347
METRIC RANK
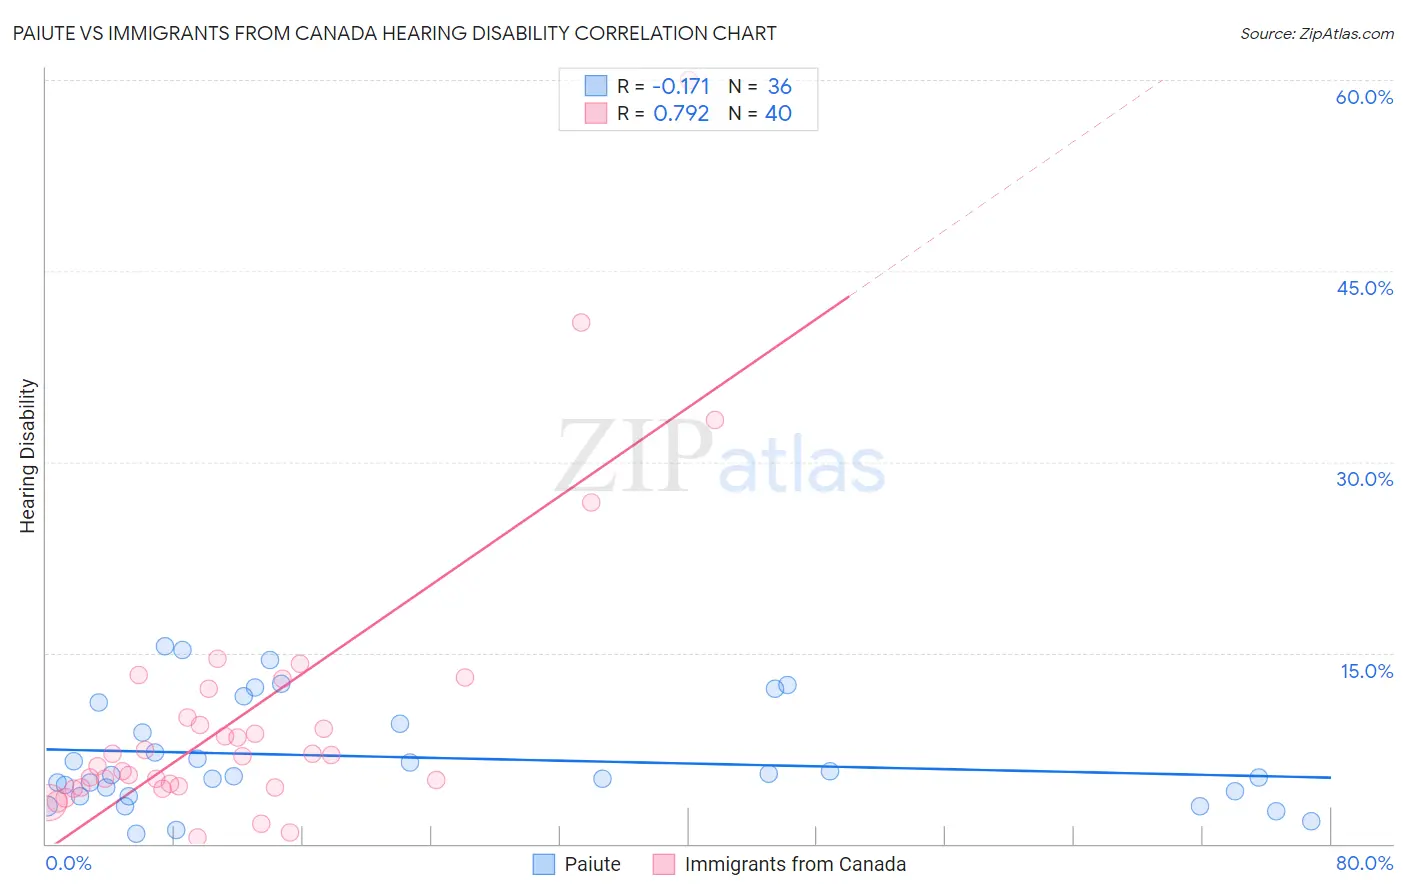
Paiute vs Immigrants from Canada Hearing Disability Correlation Chart
The statistical analysis conducted on geographies consisting of 58,392,251 people shows a poor negative correlation between the proportion of Paiute and percentage of population with hearing disability in the United States with a correlation coefficient (R) of -0.171 and weighted average of 4.1%. Similarly, the statistical analysis conducted on geographies consisting of 459,215,388 people shows a strong positive correlation between the proportion of Immigrants from Canada and percentage of population with hearing disability in the United States with a correlation coefficient (R) of 0.792 and weighted average of 3.5%, a difference of 17.6%.
Hearing Disability Correlation Summary
| Measurement | Paiute | Immigrants from Canada |
| Minimum | 0.82% | 0.49% |
| Maximum | 15.5% | 60.0% |
| Range | 14.7% | 59.5% |
| Mean | 6.8% | 10.2% |
| Median | 5.3% | 7.0% |
| Interquartile 25% (IQ1) | 3.9% | 4.5% |
| Interquartile 75% (IQ3) | 10.3% | 11.0% |
| Interquartile Range (IQR) | 6.4% | 6.6% |
| Standard Deviation (Sample) | 4.1% | 11.5% |
| Standard Deviation (Population) | 4.1% | 11.3% |
Similar Demographics by Hearing Disability
Demographics Similar to Paiute by Hearing Disability
In terms of hearing disability, the demographic groups most similar to Paiute are Seminole (4.1%, a difference of 0.26%), Apache (4.1%, a difference of 0.38%), Osage (4.1%, a difference of 0.45%), Lumbee (4.1%, a difference of 0.77%), and Potawatomi (4.1%, a difference of 1.1%).
| Demographics | Rating | Rank | Hearing Disability |
| Yakama | 0.0 /100 | #314 | Tragic 3.9% |
| Puget Sound Salish | 0.0 /100 | #315 | Tragic 3.9% |
| Spanish Americans | 0.0 /100 | #316 | Tragic 4.0% |
| Comanche | 0.0 /100 | #317 | Tragic 4.0% |
| Cheyenne | 0.0 /100 | #318 | Tragic 4.0% |
| Chippewa | 0.0 /100 | #319 | Tragic 4.0% |
| Shoshone | 0.0 /100 | #320 | Tragic 4.0% |
| Paiute | 0.0 /100 | #321 | Tragic 4.1% |
| Seminole | 0.0 /100 | #322 | Tragic 4.1% |
| Apache | 0.0 /100 | #323 | Tragic 4.1% |
| Osage | 0.0 /100 | #324 | Tragic 4.1% |
| Lumbee | 0.0 /100 | #325 | Tragic 4.1% |
| Potawatomi | 0.0 /100 | #326 | Tragic 4.1% |
| Arapaho | 0.0 /100 | #327 | Tragic 4.1% |
| Tohono O'odham | 0.0 /100 | #328 | Tragic 4.2% |
Demographics Similar to Immigrants from Canada by Hearing Disability
In terms of hearing disability, the demographic groups most similar to Immigrants from Canada are Immigrants from North America (3.5%, a difference of 0.040%), Hawaiian (3.5%, a difference of 0.16%), Portuguese (3.5%, a difference of 0.19%), Immigrants from Germany (3.5%, a difference of 0.22%), and British (3.5%, a difference of 0.24%).
| Demographics | Rating | Rank | Hearing Disability |
| Hmong | 0.2 /100 | #256 | Tragic 3.4% |
| Yaqui | 0.2 /100 | #257 | Tragic 3.4% |
| Northern Europeans | 0.2 /100 | #258 | Tragic 3.4% |
| Slovenes | 0.1 /100 | #259 | Tragic 3.5% |
| Portuguese | 0.1 /100 | #260 | Tragic 3.5% |
| Hawaiians | 0.1 /100 | #261 | Tragic 3.5% |
| Immigrants | North America | 0.1 /100 | #262 | Tragic 3.5% |
| Immigrants | Canada | 0.1 /100 | #263 | Tragic 3.5% |
| Immigrants | Germany | 0.1 /100 | #264 | Tragic 3.5% |
| British | 0.1 /100 | #265 | Tragic 3.5% |
| Belgians | 0.1 /100 | #266 | Tragic 3.5% |
| Canadians | 0.1 /100 | #267 | Tragic 3.5% |
| Spaniards | 0.1 /100 | #268 | Tragic 3.5% |
| Ute | 0.1 /100 | #269 | Tragic 3.5% |
| Europeans | 0.1 /100 | #270 | Tragic 3.5% |