Senegalese vs Immigrants from Canada Professional Degree
COMPARE
Senegalese
Immigrants from Canada
Professional Degree
Professional Degree Comparison
Senegalese
Immigrants from Canada
4.6%
PROFESSIONAL DEGREE
75.3/ 100
METRIC RATING
149th/ 347
METRIC RANK
5.3%
PROFESSIONAL DEGREE
99.7/ 100
METRIC RATING
76th/ 347
METRIC RANK
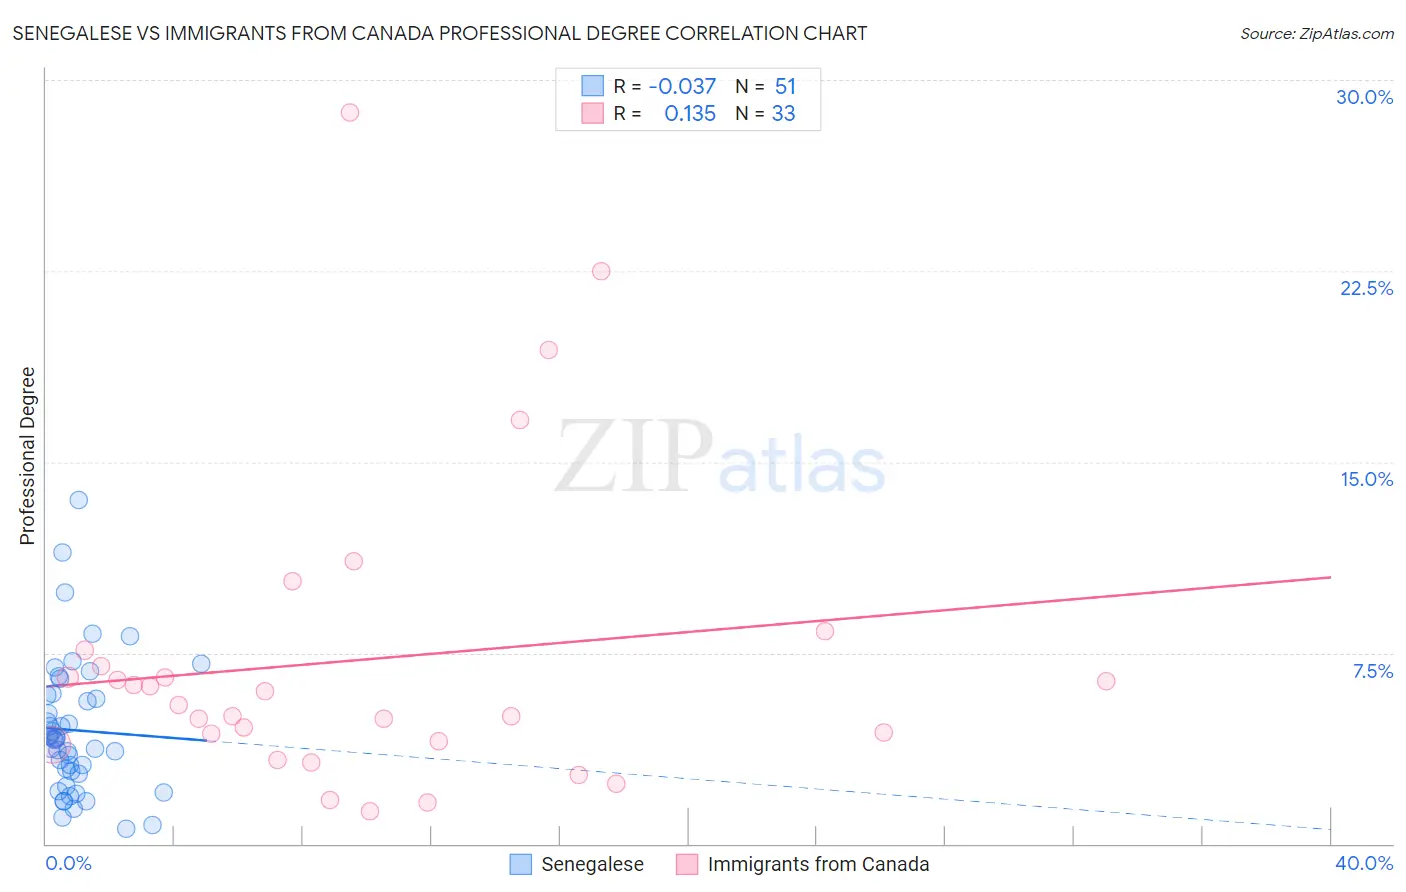
Senegalese vs Immigrants from Canada Professional Degree Correlation Chart
The statistical analysis conducted on geographies consisting of 78,103,973 people shows no correlation between the proportion of Senegalese and percentage of population with at least professional degree education in the United States with a correlation coefficient (R) of -0.037 and weighted average of 4.6%. Similarly, the statistical analysis conducted on geographies consisting of 457,915,451 people shows a poor positive correlation between the proportion of Immigrants from Canada and percentage of population with at least professional degree education in the United States with a correlation coefficient (R) of 0.135 and weighted average of 5.3%, a difference of 16.6%.
Professional Degree Correlation Summary
| Measurement | Senegalese | Immigrants from Canada |
| Minimum | 0.61% | 1.3% |
| Maximum | 13.5% | 28.7% |
| Range | 12.9% | 27.4% |
| Mean | 4.5% | 7.2% |
| Median | 4.1% | 5.5% |
| Interquartile 25% (IQ1) | 2.8% | 4.0% |
| Interquartile 75% (IQ3) | 5.8% | 7.3% |
| Interquartile Range (IQR) | 3.1% | 3.3% |
| Standard Deviation (Sample) | 2.6% | 6.1% |
| Standard Deviation (Population) | 2.6% | 6.0% |
Similar Demographics by Professional Degree
Demographics Similar to Senegalese by Professional Degree
In terms of professional degree, the demographic groups most similar to Senegalese are Slovene (4.6%, a difference of 0.14%), Immigrants from Oceania (4.6%, a difference of 0.35%), Colombian (4.6%, a difference of 0.46%), Polish (4.6%, a difference of 0.50%), and Immigrants from Africa (4.6%, a difference of 0.51%).
| Demographics | Rating | Rank | Professional Degree |
| Sudanese | 81.3 /100 | #142 | Excellent 4.6% |
| Hungarians | 80.8 /100 | #143 | Excellent 4.6% |
| Immigrants | South America | 80.5 /100 | #144 | Excellent 4.6% |
| Uruguayans | 80.2 /100 | #145 | Excellent 4.6% |
| Luxembourgers | 78.7 /100 | #146 | Good 4.6% |
| Colombians | 77.7 /100 | #147 | Good 4.6% |
| Slovenes | 76.1 /100 | #148 | Good 4.6% |
| Senegalese | 75.3 /100 | #149 | Good 4.6% |
| Immigrants | Oceania | 73.4 /100 | #150 | Good 4.6% |
| Poles | 72.6 /100 | #151 | Good 4.6% |
| Immigrants | Africa | 72.5 /100 | #152 | Good 4.6% |
| Immigrants | Uruguay | 72.5 /100 | #153 | Good 4.6% |
| Scottish | 71.8 /100 | #154 | Good 4.6% |
| Slavs | 70.8 /100 | #155 | Good 4.5% |
| Swedes | 69.9 /100 | #156 | Good 4.5% |
Demographics Similar to Immigrants from Canada by Professional Degree
In terms of professional degree, the demographic groups most similar to Immigrants from Canada are Immigrants from Ethiopia (5.3%, a difference of 0.040%), Immigrants from Indonesia (5.3%, a difference of 0.090%), Armenian (5.3%, a difference of 0.090%), Ethiopian (5.4%, a difference of 0.22%), and Immigrants from North America (5.3%, a difference of 0.26%).
| Demographics | Rating | Rank | Professional Degree |
| Immigrants | Hungary | 99.9 /100 | #69 | Exceptional 5.5% |
| Bhutanese | 99.8 /100 | #70 | Exceptional 5.4% |
| Immigrants | Western Asia | 99.8 /100 | #71 | Exceptional 5.4% |
| Lithuanians | 99.8 /100 | #72 | Exceptional 5.4% |
| Immigrants | Romania | 99.8 /100 | #73 | Exceptional 5.4% |
| Ethiopians | 99.7 /100 | #74 | Exceptional 5.4% |
| Immigrants | Indonesia | 99.7 /100 | #75 | Exceptional 5.3% |
| Immigrants | Canada | 99.7 /100 | #76 | Exceptional 5.3% |
| Immigrants | Ethiopia | 99.7 /100 | #77 | Exceptional 5.3% |
| Armenians | 99.7 /100 | #78 | Exceptional 5.3% |
| Immigrants | North America | 99.7 /100 | #79 | Exceptional 5.3% |
| Immigrants | England | 99.6 /100 | #80 | Exceptional 5.3% |
| Immigrants | Brazil | 99.6 /100 | #81 | Exceptional 5.3% |
| Romanians | 99.6 /100 | #82 | Exceptional 5.3% |
| Carpatho Rusyns | 99.6 /100 | #83 | Exceptional 5.3% |