Ottawa vs Immigrants from Croatia Bachelor's Degree
COMPARE
Ottawa
Immigrants from Croatia
Bachelor's Degree
Bachelor's Degree Comparison
Ottawa
Immigrants from Croatia
31.1%
BACHELOR'S DEGREE
0.1/ 100
METRIC RATING
287th/ 347
METRIC RANK
42.3%
BACHELOR'S DEGREE
99.2/ 100
METRIC RATING
80th/ 347
METRIC RANK
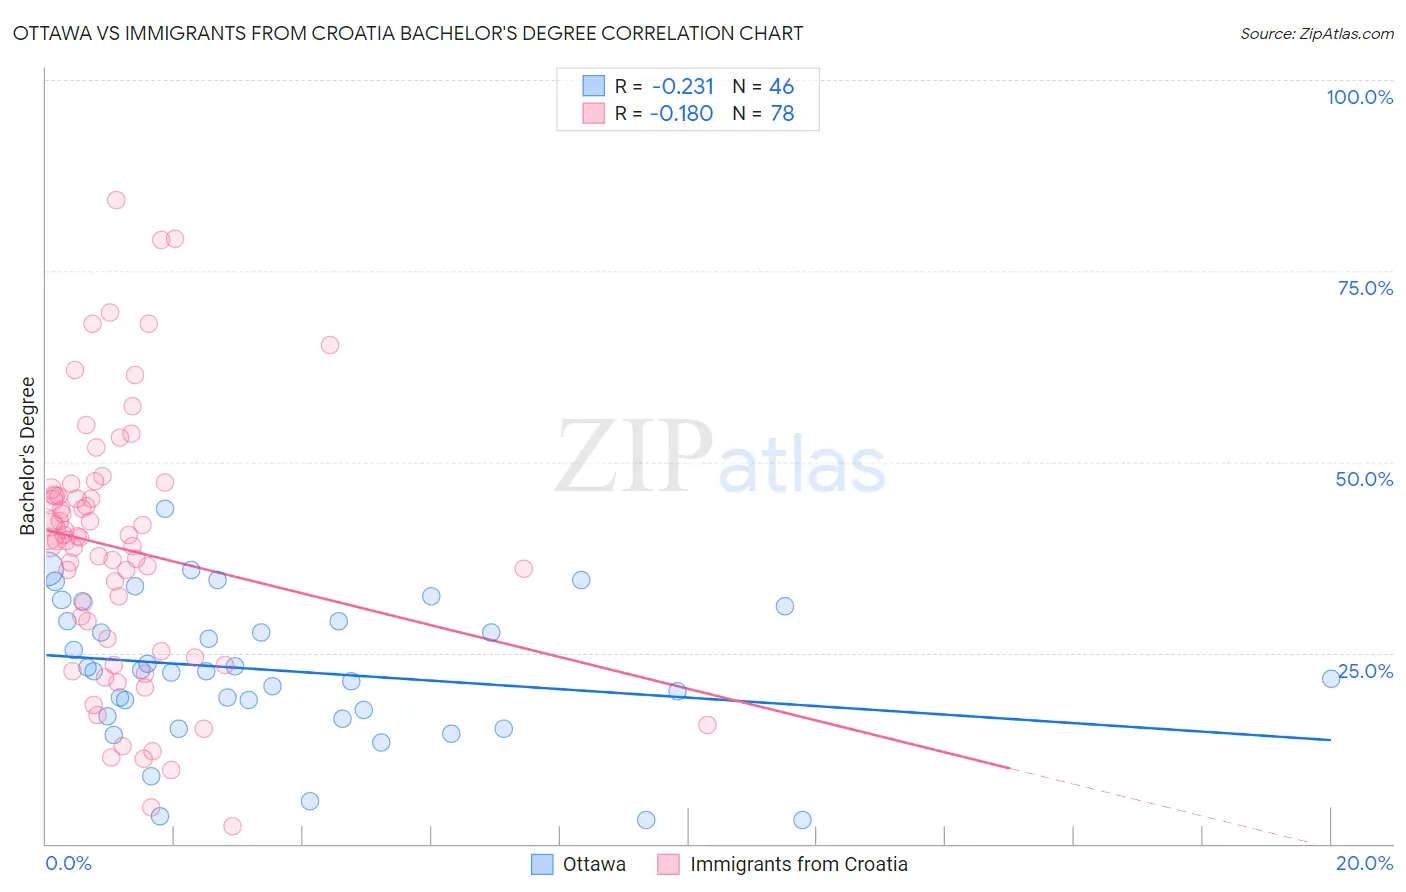
Ottawa vs Immigrants from Croatia Bachelor's Degree Correlation Chart
The statistical analysis conducted on geographies consisting of 49,955,025 people shows a weak negative correlation between the proportion of Ottawa and percentage of population with at least bachelor's degree education in the United States with a correlation coefficient (R) of -0.231 and weighted average of 31.1%. Similarly, the statistical analysis conducted on geographies consisting of 132,578,161 people shows a poor negative correlation between the proportion of Immigrants from Croatia and percentage of population with at least bachelor's degree education in the United States with a correlation coefficient (R) of -0.180 and weighted average of 42.3%, a difference of 36.0%.
Bachelor's Degree Correlation Summary
| Measurement | Ottawa | Immigrants from Croatia |
| Minimum | 3.0% | 2.2% |
| Maximum | 43.8% | 84.3% |
| Range | 40.8% | 82.1% |
| Mean | 22.6% | 38.6% |
| Median | 22.6% | 39.9% |
| Interquartile 25% (IQ1) | 16.7% | 25.2% |
| Interquartile 75% (IQ3) | 29.1% | 45.6% |
| Interquartile Range (IQR) | 12.4% | 20.4% |
| Standard Deviation (Sample) | 9.4% | 17.2% |
| Standard Deviation (Population) | 9.3% | 17.1% |
Similar Demographics by Bachelor's Degree
Demographics Similar to Ottawa by Bachelor's Degree
In terms of bachelor's degree, the demographic groups most similar to Ottawa are Guatemalan (31.0%, a difference of 0.36%), Puerto Rican (31.0%, a difference of 0.50%), Immigrants from Honduras (30.9%, a difference of 0.54%), Black/African American (30.9%, a difference of 0.58%), and Immigrants from El Salvador (31.3%, a difference of 0.62%).
| Demographics | Rating | Rank | Bachelor's Degree |
| Immigrants | Laos | 0.1 /100 | #280 | Tragic 31.6% |
| Blackfeet | 0.1 /100 | #281 | Tragic 31.5% |
| Immigrants | Caribbean | 0.1 /100 | #282 | Tragic 31.4% |
| Hondurans | 0.1 /100 | #283 | Tragic 31.3% |
| Haitians | 0.1 /100 | #284 | Tragic 31.3% |
| Aleuts | 0.1 /100 | #285 | Tragic 31.3% |
| Immigrants | El Salvador | 0.1 /100 | #286 | Tragic 31.3% |
| Ottawa | 0.1 /100 | #287 | Tragic 31.1% |
| Guatemalans | 0.1 /100 | #288 | Tragic 31.0% |
| Puerto Ricans | 0.1 /100 | #289 | Tragic 31.0% |
| Immigrants | Honduras | 0.1 /100 | #290 | Tragic 30.9% |
| Blacks/African Americans | 0.1 /100 | #291 | Tragic 30.9% |
| Ute | 0.1 /100 | #292 | Tragic 30.9% |
| Cape Verdeans | 0.1 /100 | #293 | Tragic 30.9% |
| Immigrants | Guatemala | 0.0 /100 | #294 | Tragic 30.8% |
Demographics Similar to Immigrants from Croatia by Bachelor's Degree
In terms of bachelor's degree, the demographic groups most similar to Immigrants from Croatia are Immigrants from Hungary (42.3%, a difference of 0.020%), Immigrants from Scotland (42.3%, a difference of 0.080%), Armenian (42.3%, a difference of 0.11%), Immigrants from Western Asia (42.3%, a difference of 0.13%), and Lithuanian (42.2%, a difference of 0.16%).
| Demographics | Rating | Rank | Bachelor's Degree |
| Immigrants | Uzbekistan | 99.5 /100 | #73 | Exceptional 42.8% |
| Bhutanese | 99.5 /100 | #74 | Exceptional 42.7% |
| Immigrants | Zimbabwe | 99.4 /100 | #75 | Exceptional 42.6% |
| Immigrants | Egypt | 99.4 /100 | #76 | Exceptional 42.6% |
| Immigrants | Eastern Europe | 99.4 /100 | #77 | Exceptional 42.5% |
| Immigrants | Ethiopia | 99.4 /100 | #78 | Exceptional 42.5% |
| Immigrants | Lebanon | 99.3 /100 | #79 | Exceptional 42.4% |
| Immigrants | Croatia | 99.2 /100 | #80 | Exceptional 42.3% |
| Immigrants | Hungary | 99.2 /100 | #81 | Exceptional 42.3% |
| Immigrants | Scotland | 99.2 /100 | #82 | Exceptional 42.3% |
| Armenians | 99.2 /100 | #83 | Exceptional 42.3% |
| Immigrants | Western Asia | 99.2 /100 | #84 | Exceptional 42.3% |
| Lithuanians | 99.2 /100 | #85 | Exceptional 42.2% |
| Immigrants | Brazil | 99.2 /100 | #86 | Exceptional 42.2% |
| Carpatho Rusyns | 99.0 /100 | #87 | Exceptional 42.1% |